In this Ethereum price analysis, we delve into the recent fluctuations of the cryptocurrency as it attempts to recover from a significant downturn. After a staggering 37% drop, ETH’s price plunged to $2,100, raising concerns among investors about the future of this digital asset. However, recent bullish Ethereum predictions suggest that the cryptocurrency is stabilizing above the critical resistance level of $2,730. Market observers will closely monitor Ethereum technical indicators to determine if the price can overcome crucial targets, including the Fibonacci retracement levels of $2,867 and beyond. The dynamics of Ethereum price targets will be pivotal as traders weigh both bullish momentum and bearish outlooks in the weeks ahead.
When analyzing the behavior of Ethereum, it’s essential to consider various facets of its recent performance. The cryptocurrency has been marked by volatility and significant price movements, prompting many analysts to explore potential recovery scenarios. With various Ethereum price levels once again coming into play, investors are eager to understand how technical aspects and external market forces will shape the next moves. Furthermore, the interplay between bullish and bearish sentiment is critical in navigating the current landscape. As we explore the future possibilities for ETH, staying updated on price targets and market signals is more important than ever.
Ethereum Price Analysis: Recent Movements and Trends
The recent price action of Ethereum (ETH) displays a complex interplay between bearish and bullish forces. After experiencing a substantial sell-off at the beginning of the week that plummeted the price to notable lows around $2,100, the market witnessed a rapid recovery. Currently, Ethereum’s price has rebounded to approximately $2,762, significantly above the breakout level identified last November. This price movement is crucial, as it indicates that Ethereum is attempting to stabilize after catastrophic losses. Understanding Ethereum’s price dynamics involves analyzing support and resistance levels, which play pivotal roles in determining the subsequent price trajectory.
The latest Ethereum price analysis must also consider the broader market influences contributing to this volatility. External factors, such as regulatory news and macroeconomic events, have instigated sharp price movements. The push from major institutional players, including Blackrock and Fidelity, adding considerable amounts of ETH in spot ETF inflows has also provided a much-needed boost. Monitoring technical indicators and resistance levels will be critical in the upcoming trading days to gauge whether Ethereum can maintain its upward momentum or if another bearish phase is imminent.
Frequently Asked Questions
What are the current Ethereum price targets based on recent analysis?
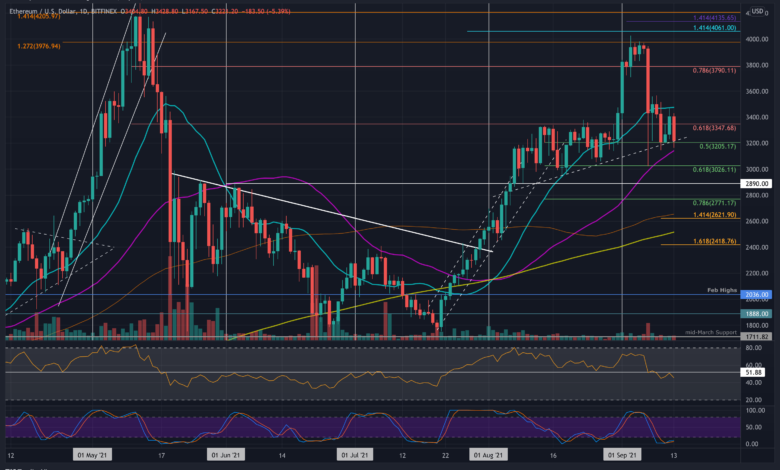
The current Ethereum price targets include bullish levels at $2,867, $3,025/$3,105, and up to $4,865. Conversely, bearish price targets for Ethereum are set at $2,730 and down to $1,516. These targets reflect a technical analysis of Ethereum’s price movements and market conditions.
How does the recent Ethereum price recovery influence ETH price predictions?
The recent recovery of Ethereum’s price suggests bullish momentum, especially if the price stabilizes above $2,730. A successful hold at this level could target $2,867 as the next resistance point, positively influencing ETH price predictions in the short term.
What technical indicators are important for Ethereum price analysis?
Key technical indicators for Ethereum price analysis include the Relative Strength Index (RSI), which helps assess overbought or oversold conditions. Currently, the RSI is deep in the oversold territory, indicating potential for price recovery if it breaks above 55 on the daily chart.
What does the bearish outlook for Ethereum mean for investors?
The bearish outlook for Ethereum suggests potential price declines, particularly if the price drops below $2,730. Investors should remain cautious, as further declines could target lower levels such as $2,228 and down to $1,516, prompting careful consideration of their positions.
Are there signs of bullish Ethereum predictions based on current trends?
Yes, bullish Ethereum predictions hinge on the ability to hold above critical support levels. If Ethereum can regain strength above $2,730 and break through resistance zones, it could target higher levels towards $3,967, strengthening the bullish sentiment in the market.
| Key Points |
|---|
| Ethereum appears to be recovering from a recent sell-off, having fallen to as low as $2,100 but rebounding to $2,762. |
| The Ether price faced significant selling pressure due to geopolitical fears and massive liquidations amounting to over $500 million. |
| Critical resistance levels to watch for a potential price reversal include $2,867 and $3,105, with the line in the sand at $3,327. |
| Bullish targets for Ethereum in the coming weeks are set between $2,867 and $4,865, featuring various Fibonacci levels. |
| Bearish price targets suggest a focus on maintaining support above $2,730, with concerns if the price drops below key support levels. |
| Indicators show the RSI moving into oversold territories, with potential for recovery depending on market conditions. |
Summary
Ethereum price analysis reveals a crucial moment for the second-largest cryptocurrency as it attempts to stabilize following a significant sell-off. The price dynamics suggest that overcoming established resistance levels is vital for a sustainable upward trend. Market sentiment will largely dictate whether Ethereum can reclaim its former highs or if bearish pressures will dominate in the near future.