Bitcoin Price Analysis: Bullish Breakout Near $100K

Bitcoin price analysis is crucial for understanding the current dynamics of the cryptocurrency market. As the digital currency fluctuates between $96,869 and $97,057, it is clear that traders are keenly monitoring price movements and market sentiment. With a robust market capitalization of $1.92 trillion and a significant 24-hour trading volume of $27.81 billion, Bitcoin remains a focal point for investors. This analysis helps forecast BTC price predictions by revealing emerging trends and potential trading strategies. By examining Bitcoin market trends, traders can devise effective approaches for investing in Bitcoin, maximizing their chances of success.
Exploring the landscape of Bitcoin requires a comprehensive look at price evaluations within the crypto realm. This assessment focuses on the evolving value of the leading digital currency, emphasizing essential cryptocurrency market behaviors. By interpreting Bitcoin’s recent performance, analysts can outline strategic trading frameworks tailored to capitalize on shifting market conditions. Such evaluations, often referred to as digital asset evaluations, provide insights into potential price trajectories and inform investors on how best to navigate the market. Ultimately, understanding these key analytics is critical for those aiming to thrive in the competitive world of cryptocurrency investments.
Bitcoin Price Analysis: Current Market Trends
Bitcoin has recently demonstrated a remarkable resilience as it traded between $96,869 and $97,057, remaining within a tight range that showcases robust market interest. With its current trading volume reaching $27.81 billion over the last 24 hours and a market capitalization of $1.92 trillion, it’s clear that investors are still significantly invested in Bitcoin. This steady performance near its highs reflects growing confidence in the cryptocurrency market, particularly following a bullish breakout from a previous consolidation zone of $74,000 to $84,000.
The analysis of the daily BTC/USD chart reveals a clear bullish sentiment, with a recent surge to $97,470 indicating strong upward momentum. A pullback to the $90,000–$92,000 range could provide a strategic entry point for traders aiming to capitalize on the anticipated continuation of this bullish trend. The potential for a medium-term target at $100,000 is highly possible, should the price break above the immediate resistance at $97,500.
Understanding Bitcoin Market Trends
Bitcoin’s recent performance illustrates the importance of analyzing market trends before making investment decisions. Clearly defined bullish patterns are emerging, influenced by strong buying volumes. Technicians highlight an ascending triangle pattern that may lead to further upward movement should the price break the resistance barrier at $97,500. Conversely, the BTC price remains sensitive to broader market dynamics and could see fluctuations as traders and investors react to news and market sentiment.
Moreover, the market’s current support around $88,000 signifies a critical level for Bitcoin. Investors and traders should closely monitor price action around this support zone, especially as the market undergoes fluctuations. By employing sound Bitcoin trading strategies, investors can better position themselves to succeed in the volatile cryptocurrency environment.
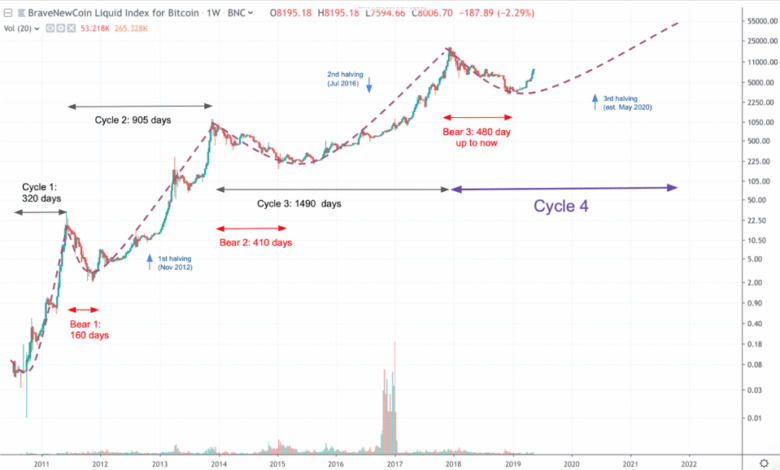
Analyzing historical market behavior alongside current trends can often provide insights, suggesting where Bitcoin may head next. Evaluating these market trends will aid in making informed decisions, especially when considering both short- and long-term investing in Bitcoin.
Effective Bitcoin Trading Strategies for Investors
Navigating the volatile realm of cryptocurrency trading requires strategic planning and adaptive strategies to optimize success. With the current bullish outlook on Bitcoin, employing effective trading strategies is more crucial than ever. For instance, traders are advised to focus on breakout confirmations, particularly above the pivotal resistance level of $97,500. This can signal strong buying pressure and offer a lucrative entry point for aggressive traders.
Moreover, creating a risk management plan that includes prudent stop-loss placements below critical support levels, such as $96,000, allows traders to safeguard their investments against unexpected market movements. The consolidation within a tight range serves to heighten the anticipation of a breakout. As such, keeping an eye on volume trends when executing trades can significantly improve trading outcomes.
Bitcoin Market Volume Indicators and Their Impact
Trading volume plays a vital role in analyzing Bitcoin’s short-term trends, offering insights into market strength and direction. The recent volume spikes during upward maneuvers highlight the potential for sustained bullish momentum. Conversely, low-volume pullbacks suggest caution and point towards the necessity for confirmation before entering new positions. As Bitcoin consolidates within the $96,500 to $97,500 range, traders should remain alert to changes in volume, as this could act as an indicator for future price movement.
Additionally, volume’s relationship with price action helps determine the viability of breakouts. A confirmed breakout supported by increased volume implies that the market is in a strong position to push higher. Analysts often use tools such as moving averages and momentum indicators alongside volume analysis to gain a comprehensive view of market behavior, which is essential for anyone actively trading Bitcoin.
Oscillator Signals: Interpreting Bitcoin’s Market Condition
When analyzing Bitcoin’s price movements, oscillator signals can offer valuable insights into market conditions. Currently, oscillators such as the RSI and stochastic indicators reflect a neutral stance, indicating a balanced market. Nonetheless, the presence of mixed signals, particularly from the MACD and other indicators, suggests caution for traders. Investors must consider these oscillators in conjunction with price trends, as they can preempt potential shifts in market momentum.
Understanding how oscillators function within different market contexts helps traders anticipate price movements more accurately. For instance, should oscillators begin to turn bullish while price approaches resistance, it could signal a significant breakout opportunity. Conversely, if these indicators maintain a bearish inclination amidst price increases, traders might want to reassess their positions.
The Role of Moving Averages in Bitcoin Analysis
Moving averages are crucial tools for traders and investors looking to analyze Bitcoin’s market trends effectively. Currently, both short-term and long-term moving averages signal bullish trends, reinforcing the notion that the market remains in a strong upward trajectory. Observing how these moving averages interact with Bitcoin’s price can help traders determine optimal entry and exit points.
Moreover, as moving averages lend support during price corrections, they can serve as reliable indicators for trade execution. For instance, should the price retrace to the major moving averages without major fluctuations in volume, it might present a favorable buying opportunity, affirming investment strategies focusing on Bitcoin’s growth.
Bullish versus Bearish Outlook in Bitcoin Trading
Investors are often torn between bullish and bearish market sentiment when trading Bitcoin. The recent bullish setup hints at further price growth, especially with indications that the $100,000 milestone is on the horizon. Acknowledging the fundamental market drivers behind Bitcoin’s price can help traders maintain an optimistic viewpoint, provided key resistance levels continue to hold firm.
However, some caution is warranted as Bitcoin faces critical resistance points that could affect its potential upward momentum. A failure to break above the $97,500 level might trigger a reversal, leading the price back toward the $94,000 zone. Therefore, assessing both bullish and bearish signals becomes essential for traders who wish to maximize their investments while minimizing risks.
The Importance of Market Sentiment in Cryptocurrency Investing
Market sentiment plays a pivotal role in determining Bitcoin’s price fluctuations. Factors such as news events, regulatory developments, and overall economic conditions contribute to the prevailing sentiment among investors. Given Bitcoin’s volatility, understanding these external influences can sharpen an investor’s strategy and response during price transitions.
Additionally, keeping a pulse on community sentiment—from social media discussions to trends in Bitcoin’s trading volume—enables investors to gauge public perception. Those who can accurately interpret market sentiment are more likely to make informed decisions, optimizing their trading strategies and investment timing in the gripping world of cryptocurrencies.
Frequently Asked Questions
What are recent Bitcoin market trends affecting BTC price prediction?
Recent Bitcoin market trends indicate a strong bullish sentiment, with BTC trading between $96,869 and $97,057. This tight range near recent highs demonstrates sustained investor interest. The breakout from the $74,000 to $84,000 consolidation zone to a surge up to $97,470 reinforces positive BTC price predictions.
How can I analyze Bitcoin trading strategies based on price fluctuations?
To analyze Bitcoin trading strategies, observe price fluctuations such as the recent 24-hour intraday range of $95,925 to $97,341. Identifying support and resistance areas—like the current support around $88,000 and resistance near $97,500—can guide strategic entries. A pullback to the $90,000–$92,000 range represents a potential lower-risk long entry.
What does recent cryptocurrency analysis suggest about Bitcoin’s future value?
Recent cryptocurrency analysis indicates a potential upward trajectory for Bitcoin, particularly with bullish trends shown in the daily and 4-hour charts. The confirmation of a micro-support zone at $94,000 might provide opportunities for traders, especially if buying volumes continue to increase, supporting higher future values.
Are there specific Bitcoin price analysis indicators to watch right now?
Yes, watch for Bitcoin price analysis indicators such as moving averages, which are signaling bullish momentum across different time frames. Additionally, the oscillators like RSI and MACD suggest a mixed setup, implying that traders should look for volume confirmation before significant market entries.
What current Bitcoin trading strategies should investors consider?
Current Bitcoin trading strategies should involve monitoring resistance at $97,500 closely while looking for breakout confirmations above this level. If a breakout occurs with strong volume, a target of $99,000 to $100,000 could be feasible. Also, considering dip buying in the $90,000–$92,000 range is advisable for lower-risk positions.
How do Bitcoin market trends reflect on investments in Bitcoin?
Bitcoin market trends reflect strong investment potential, particularly with a market capitalization of $1.92 trillion and a trading volume of $27.81 billion. This consistent interest and positive price movements suggest that investing in Bitcoin could yield significant returns if trends remain favorable.
What are the implications of BTC price predictions for short-term traders?
For short-term traders, BTC price predictions suggest that attention should be given to the $97,500 resistance level. A breakout above this level with volume support may present short-term trading opportunities, targeting higher prices while managing risk through stop-loss placements.
What factors should investors consider in Bitcoin price analysis?
Investors should consider factors such as market volume, resistance levels, and prevailing bullish patterns in Bitcoin price analysis. Observing the mixed signals from oscillators and ensuring confirmation from volume are crucial for making informed investment decisions.
Can Bitcoin trading strategies guarantee profit?
While Bitcoin trading strategies can significantly enhance the probability of profitable trades, they cannot guarantee profits due to market volatility and unpredictability. Continuous analysis and adapting strategies based on price movements and market behavior are essential.
What are the key resistance levels in Bitcoin price analysis right now?
Key resistance levels in current Bitcoin price analysis are around $97,500. A sustained breakout above this level is needed to validate bullish forecasts and move towards higher targets like $100,000.
| Key Metric | Value |
|---|---|
| Latest Price Range (1 hour) | $96,869 – $97,057 |
| 24-hour Intraday Range | $95,925 – $97,341 |
| Market Capitalization | $1.92 trillion |
| 24-hour Trading Volume | $27.81 billion |
| Current Support Level | $88,000 |
| Immediate Resistance Level | $97,500 |
| Projected Price Targets | $90,000 – $92,000 (pullback entry), $97,500 (short-term), $100,000 (medium-term) |
| Major Moving Averages Signal | Buy signals across all MAs |
| Bear Verdict | Resistance at $97,500 may trigger reversal if unsuccessful |
Summary
Bitcoin price analysis indicates that the leading cryptocurrency is maintaining a bullish trajectory, with solid resistance levels established at $97,500. A breakout past this level could pave the way for price movements towards the significant psychological milestone of $100,000. Meanwhile, a current support level has formed around $88,000, and the overall market shows sustained investor interest, underscored by robust trading volumes. The analysis highlights a potential pullback entry in the $90,000–$92,000 range, with optimistic short and medium-term targets, emphasizing the importance of monitoring trading volume and price behavior as decisions are made.


