XRP Technical Analysis: Downtrend Dominates—$2.05 at Risk
XRP technical analysis reveals a current market dominated by downtrends, posing critical questions about the future movements of this popular cryptocurrency. As of now, XRP is trading at $2.16, reflecting volatility within a tight price range, typical of ongoing XRP price analysis. Traders are closely monitoring the XRP trading strategy in light of fluctuating support and resistance levels, especially with the significant price floor around $2.05 potentially at risk. Cryptocurrency trends indicate a cautious optimism among investors, but the technical indicators suggest a need for strategic decision-making. For those looking at XRP market outlook and long-term strategies, recognizing these movements is essential for maximizing potential gains in a shifting landscape.
An in-depth look at XRP’s price indicators and patterns is crucial for both novice and seasoned traders facing current market conditions. By examining XRP’s trading frameworks and price fluctuations, deeper insights can be gleaned into potential future movements and investment strategies. The importance of understanding critical support and resistance levels cannot be overstated, as they guide trading decisions amid prevailing cryptocurrency trends. Observing short-term recoveries and price accumulations may reveal hidden opportunities within the XRP market outlook. Ultimately, leveraging technical analysis in this evolving digital currency arena can shape a trader’s approach and enhance their readiness to capitalize on market shifts.
XRP Technical Analysis: Current Price Trends
XRP is presently experiencing a precarious trading environment, fluctuating around $2.16 with a market capitalization of $127 billion. In the past 24 hours, the asset has shown minimal movement, illustrating a tight price range between $2.11 and $2.18. Such limited fluctuations can often signify a build-up of momentum, urging both traders and investors to pay close attention. For those deploying an XRP trading strategy, these price points provide crucial clues about potential breakout opportunities in the near term.
Analyzing the one-hour chart reveals a potential recovery trend, as XRP bounces back from the lower support around $2.11 to reclaim levels near $2.17. The formation of higher lows indicates that momentum could swing in favor of the bulls on intraday trades. Active traders may find enticing buy spots within the $2.13-$2.14 range, as they look to capitalize on minor price retracements. This recovery phase is significant as it may set the stage for a more prominent bullish trend if XRP can decisively break past resistance at $2.18.
Frequently Asked Questions
What is the current trend in XRP technical analysis?
The current trend in XRP technical analysis indicates a prevailing downtrend, with price fluctuations confined between $2.10 and $2.18 recently. This pattern suggests bearish pressure, especially with key moving averages indicating negative sentiment. Traders should monitor the $2.05 support level closely for potential breakouts.
How do XRP support and resistance levels affect trading strategies?
XRP support and resistance levels play a crucial role in developing effective trading strategies. Currently, strong support is observed around $2.05, while resistance ranges between $2.30 and $2.35. Traders can utilize these levels to identify entry points; for instance, buying near the support level and setting stop-loss orders just below it can help manage risk.
What does XRP price analysis indicate about its short-term future?
XRP price analysis suggests a cautious bullish outlook in the short term, particularly in the one-hour chart that reflects higher lows and accumulation. If XRP successfully breaks above the $2.18 resistance, it may target $2.25, but traders should confirm the breakout with robust volume before entering positions.
What are the implications of the current trading volume on XRP’s market outlook?
The current trading volume for XRP indicates moderate activity, underscoring cautious optimism among traders. While the lower volume suggests limited momentum, any significant spikes could either reinforce the ongoing downtrend or signal potential bullish reversals, depending on price movement relative to key levels.
How can traders identify potential bullish reversals in XRP?
Traders can identify potential bullish reversals in XRP by watching for significant price shifts above critical resistance levels, particularly near $2.20. Confirmations through increased trading volume and patterns such as higher lows on the four-hour chart can also signal a shift from bearish to bullish momentum.
What should XRP traders look for on the daily chart?
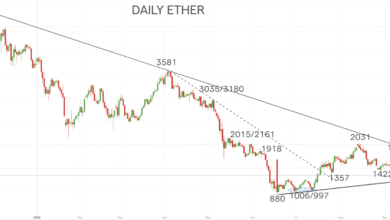
On the daily chart, XRP traders should look for confirmation of trend changes. A higher low above $2.20, accompanied by a decline in selling pressure and positive movement from oscillators like the RSI, may indicate a reversal. Attention should also be on the $2.05 support level, as breaking below could lead to further declines.
What role do momentum indicators play in XRP’s technical analysis?
Momentum indicators such as the MACD and Momentum Oscillator in XRP’s technical analysis provide insights into market sentiment. Currently, the MACD indicates bearish bias, while the 10-period Momentum Oscillator suggests a potential bullish shift, highlighting the mixed signals that traders should consider for their strategies.
How do cryptocurrency trends impact XRP trading strategies?
Cryptocurrency trends significantly impact XRP trading strategies. Overall market sentiment, trends in Bitcoin and other major currencies, and investor behavior can influence XRP’s performance. Traders should stay updated on these trends to effectively capitalize on potential price movements and adjust their strategies accordingly.
| Aspect | Details |
|---|---|
| Current Price | $2.16 |
| Market Capitalization | $127 billion |
| 24-hour Trading Volume | $1.438 billion |
| Price Range (24h) | $2.11 – $2.18 |
| Short-Term Outlook (1 hr) | Upward trend from $2.11 to $2.17; potential long positions near $2.13-$2.14. |
| Intermediate Outlook (4 hr) | Consolidation within $2.10 – $2.17; breakout above $2.18 could signal bullish reversal. |
| Long-Term Outlook (Daily) | Broad downtrend; critical support at $2.05; potential reversal above $2.20-$2.22. |
| Key Indicators | RSI at 44.17 (neutral); MACD suggests bearish sentiment; overall indicators are mixed. |
Summary
XRP technical analysis shows that while there are signs of short-term accumulation, the overall trend remains bearish, with critical support levels at $2.05. Currently trading at $2.16, XRP’s price action is tightly constrained, and a significant breakout is necessary to reverse the prevailing negative sentiment. Traders should be cautious, keeping an eye on resistance levels and waiting for validation of any recovery to ensure informed trading decisions.


