NEAR Price Analysis: Identifying Support and Trend Reversal

In the realm of cryptocurrency, NEAR price analysis provides valuable insights into market trends and potential future movements. Following a notable pullback towards 1.80 US dollars, NEAR has managed to establish a possibly sustainable support zone, which could be pivotal for traders and investors alike. This phase of accumulation suggests a potential trend reversal, yet the overarching downward trajectory remains a concern. Key levels of resistance, particularly the 50-day EMA, will define the next critical moves for NEAR as traders develop their NEAR trading strategies. Understanding these dynamics through NEAR technical analysis is essential for navigating the intricacies of the NEAR cryptocurrency market.
Analyzing the current state of NEAR offers an intriguing perspective on digital asset trends. The cryptocurrency recently showed resilience after retracing to around 1.80 US dollars, where it set a significant support zone for future trading opportunities. Observations indicate that a possible shift in momentum could be on the horizon, as traders assess the framework for a reversal pattern. These insights, captured through detailed technical evaluations, assist market participants in refining their trading strategies. With an emphasis on pivotal resistance points, staying informed about the NEAR trend reversal can position traders effectively within this evolving landscape.
Understanding NEAR Price Analysis
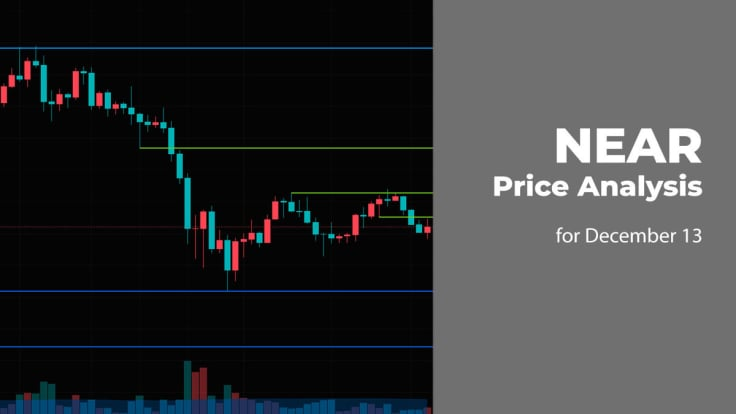
In the realm of cryptocurrency trading, understanding price behavior is paramount. The NEAR price analysis shows a recent shift towards establishing a support zone around 1.80 US dollars after a notable pullback. This level indicates a potential foundation for accumulation, as traders are keeping a close watch for signs of a trend reversal. With the market showing signs of stabilization within this range, investors are weighing their strategies carefully, as movements toward a breakout above resistance levels can signal a shift in momentum.
A critical aspect of NEAR price analysis entails monitoring the performance relative to the 50-day EMA. This moving average has proven to be a formidable resistance line, demonstrating its role as a decision point in market dynamics. For a genuine trend reversal to occur, NEAR must first clear this barrier and then navigate beyond previous local highs, ultimately aiming for the 2.20 to 2.30 USD vicinity. Until such a breakout is achieved, the sentiment remains moderately bearish, cautioning investors against aggressive positioning.
NEAR Trading Strategies to Maximize Gains
As NEAR exhibits a stabilization phase, deploying effective NEAR trading strategies becomes crucial for traders looking to capitalize on market movements. A robust strategy involves utilizing both technical analysis tools and understanding broader market sentiments. Incorporating indicators like the MACD and RSI can provide insights into market momentum, indicating whether the conditions are ripe for entry or exit. Understanding the phases of price consolidation in NEAR will help traders identify optimal points for executing trades.
Another key component of trading strategies with NEAR involves recognizing significant price levels, such as the strong resistance at 2.247 US dollars. This level has historically acted as a selling zone, and traders must remain vigilant of price behavior around this threshold. A combined breakout above this resistance and the 200 EMA could reenergize bullish sentiment and create opportunities for profitable trades. Hence, a strategy must prioritize identifying these critical levels while managing risk through stop-loss orders.
The Importance of Support Zones in NEAR
Support zones serve as critical pivot points in trading, especially for assets like NEAR that are experiencing fluctuations. The establishment of a support zone at approximately 1.80 US dollars has garnered attention as it marks a space where buyers might be willing to step in, seeking value after price depreciation. This security can lead to shifts in market sentiment, potentially giving rise to upward trends if sufficient buying pressure accumulates.
Understanding the dynamics of support zones can significantly improve trading outcomes. The 1.80 US dollar level will be closely monitored by traders as it could foster a reversal pattern if defended effectively against bearish pressure. In this context, the ongoing support indicates a possible foundation for a recovery phase in NEAR’s price, encouraging traders to watch for signals that would affirm the strength of this support in upcoming trading sessions.
Technical Indicators for NEAR’s Future Movements
Technical analysis plays a pivotal role in forecasting NEAR’s future movements, especially in a seemingly neutral to slightly bearish market. Tools such as Moving Averages, MACD, and Fibonacci retracement levels provide insights into potential price action. Currently, traders are looking at existing resistance structures to determine entry points, focusing on MA tools like the 50-day and 200 EMA, which have been vital in delineating price paths.
For NEAR, the MACD and RSI indicators currently suggest a consolidation phase, cumulatively defining market strength. Neutral readings from these indicators prompt traders to evaluate their strategies, balancing potential risk and reward. Clear signals from these technical indicators can guide decisions whether to hold positions, add to them, or exit trades cautiously as market behavior unfolds.
The Role of Market Sentiment in NEAR Trading
Market sentiment plays a critical role in the trading of NEAR, impacting price dynamics and trader behavior. As NEAR establishes its support zone, the overall market sentiment appears to be cautious yet hopeful for a trend reversal. Traders are attuned to news and developments that could influence sentiment dramatically, including broader market sentiment trends in cryptocurrency.
The sentiment surrounding NEAR is significantly shaped by recent price movements and consolidation patterns. Analyst forecasts and community discussions contribute to this environment, whereby positive news could spark buying interest, while negative developments might trigger selling pressure. Therefore, understanding market sentiment can equip traders with the context needed to make informed trading decisions.
Identifying Trend Reversal Patterns for NEAR
Identifying trend reversal patterns is essential for traders looking to make profitable decisions in NEAR’s volatile market. The current analysis suggests that a potential W-formation could be on the horizon, marking a significant price reversal opportunity if the local low at 1.80 US dollars is maintained. Such patterns often provide traders with early signals to shift their strategies toward a more aggressive posture as the market transitions.
A confirmed reversal requires demonstrable price action, primarily a decisive breakthrough of the 50-day EMA and elevated prices above recent highs in the 2.20 to 2.30 USD range. Strategically, traders should remain alert for these setups, as they could signify the start of a new bullish phase post-accumulation. Properly recognizing and acting upon these patterns can enhance profitability in NEAR trading.
Analyzing Liquidity Pools in NEAR’s Market
Understanding liquidity pools is paramount for gauging price movements within the NEAR market. The current landscape shows significant liquidity below and on either side of the price zone, which indicates potential points for market manipulation through liquidations. Traders should carefully analyze these zones to anticipate possible price shakeouts, as the market may gravitate toward these liquidity pools to trigger long or short positions.
The presence of open long positions beneath the current price presents a short-term tactical consideration; a breakdown could lead to a rapid decline as those positions are liquidated. Conversely, any upward breakout may trigger substantial short liquidations above, propelling NEAR into a bullish trajectory. This interplay of liquidity dynamics is essential for traders to understand market sentiment and potential volatility.
Future Outlook for NEAR Cryptocurrency
The future outlook for the NEAR cryptocurrency appears cautiously optimistic, grounded in the establishment of vital support levels and potential trend-reversal patterns. While the overarching trend remains bearish, the ongoing consolidation indicates that market participants are preparing for possible upward moves. Watchfulness around key resistance levels like the 50 EMA will be crucial for unlocking bullish momentum.
As the landscape of cryptocurrency continues to evolve, NEAR’s adaptability will be imperative in attracting both long-term investors and short-term traders together. The ability to pivot based on technical analysis, market sentiment, and broader cryptocurrency trends will shape NEAR’s journey moving forward, making it a fascinating asset to monitor for those involved in the crypto trading realm.
Frequently Asked Questions
What recent patterns have emerged in NEAR price analysis?
Recent NEAR price analysis indicates a notable pullback towards 1.80 US dollars, where it established a potential support zone. This phase may suggest accumulation before a possible trend reversal, although the overall downward trend remains intact.
How does NEAR’s current technical analysis influence trading strategies?
The current NEAR technical analysis shows that for a confirmed trend reversal, the price must break above the 50-day EMA, acting as a significant resistance level. Traders should consider this level in their NEAR trading strategies as it may provide crucial entry signals.
What is the significance of the NEAR support zone at 1.80 US dollars?
The NEAR support zone established at 1.80 US dollars is vital as it may act as a foundation for potential price recovery. If this level is defended, NEAR could form a W-formation, signaling a possible medium-term trend reversal.
What key resistance levels should I watch in NEAR price analysis?
Key resistance levels in NEAR price analysis include the 50 EMA and the area between 2.20 to 2.30 US dollars. A breakout beyond these levels is critical for confirming a trend reversal and enhancing bullish NEAR trading strategies.
How does the V-formation impact NEAR price forecasts?
The recent V-formation observed in the NEAR price chart suggests a potential bullish reversal after a period of weakness. This is a crucial pattern for traders to note, as it implies an upcoming price increase if it consolidates well.
What indicators are critical in understanding NEAR’s trading momentum?
In NEAR price analysis, indicators like the MACD and RSI are currently showing neutral signals, indicating a phase of direction finding. These indicators help traders gauge momentum and potential future movements.
What does the liquidation profile indicate for NEAR price action?
The liquidation profile of NEAR suggests significant liquidity pools below and above the current price zone, indicating potential volatility. A breakout could trigger liquidations that may accelerate price movement, impacting short-term trading strategies.
What factors could confirm a NEAR trend reversal?
A confirmed NEAR trend reversal hinges on breaking the resistance levels at the 50-day EMA and rising above the local interim high in the 2.20 to 2.30 US dollar range, according to recent NEAR price analysis.
| Key Point | Description |
|---|---|
| Support Zone Established | NEAR found support around 1.80 US dollars, indicating a potential phase of accumulation. |
| Resistance Level | The 50-day EMA is a key resistance point that needs to be broken for a trend reversal to occur. |
| W-formation Potential | Defending the 1.80 US dollars low could lead to a W-formation, confirming a bullish reversal if the 50 EMA is surpassed. |
| 4-Hour Charts Insights | Following a V-formation, NEAR has stabilized without significant pullbacks, indicating market strength. |
| Consolidation Resistance | The price zone around 2.247 US dollars is significant, with multiple past resistances that need to be overcome for potential upward movement. |
| Liquidation Profile | Larger liquidity pools exist around the current price zone, suggesting potential short-term volatility. |
Summary
In this NEAR price analysis, the recent establishment of support at 1.80 US dollars signals a cautious optimism, albeit amidst a prevailing overarching downward trend. Continued rally and breakout above key resistance levels, particularly the 50-day EMA and the 2.247 US dollars mark, are essential for a confirmed bullish reversal. As NEAR consolidates on the 4-hour chart, investors should remain alert to potential price movements driven by the current liquidations structured around this critical price action.


