Bitcoin Price Analysis: Bearish Pressure Amid Uptrend Support

Bitcoin Price Analysis reveals the current state of the cryptocurrency market, particularly focusing on Bitcoin’s price today, which sits at an impressive $96,101. With a staggering market capitalization of $1.907 trillion and daily trading volume reaching $21.413 billion, traders are keenly observing the fluctuations within this heavily scrutinized asset. The recent bullish trend witnessed during a rise from $74,434 to a peak of $97,938 has sparked discussions among investors, especially considering the recent dip in trading volume. As Bitcoin’s market analysis indicates potential shifts, traders are urged to be vigilant about support levels and possible pullbacks. With various indicators suggesting a mix of bullish and bearish sentiments, cryptocurrency price prediction remains a hot topic among analysts, heightening the intrigue around Bitcoin’s future performance.
In the realm of digital currencies, a thorough examination of Bitcoin’s market dynamics is crucial for informed trading decisions. With its current valuation and significant market presence, many enthusiasts focus on Bitcoin’s trading metrics and overall performance trends. Recent developments have spurred interest in alternative price prediction techniques and market forecasts as traders dissect both bullish and bearish signals. This landscape reflects the broader implications of cryptocurrency trading and the necessity for strategic market analysis. Following these trends can provide valuable insights into the ongoing shifts in the rapidly evolving world of crypto assets.
Current Bitcoin Price Trends and Analysis
As of today, Bitcoin is trading at approximately $96,101, with a market capitalization exceeding $1.907 trillion. The active trading volume for Bitcoin over the last 24 hours reached an impressive $21.413 billion. These figures highlight the cryptocurrency’s stability despite the underlying volatile changes in its price. Bitcoin’s performance is crucial for investors and traders who are closely monitoring the fluctuations to make informed betting decisions.
The current price movement suggests that Bitcoin is at a pivotal point. Having reached a high of $97,938, it has shown bullish tendencies since rebounding from a lower price of $74,434. However, the retreating trading volume during this rally indicates a possible depletion of upward momentum, raising concerns about its movements in the immediate future.
Bitcoin Price Analysis: Understanding Market Dynamics
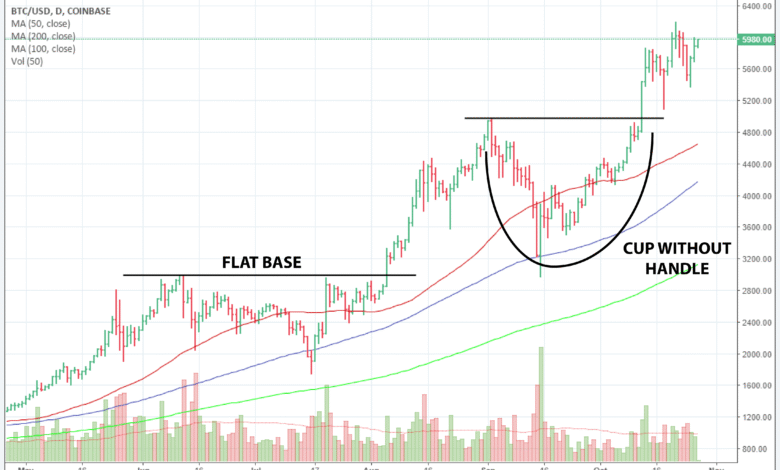
The recent market behavior reveals important trends for Bitcoin price analysis. The emergence of a rising wedge pattern indicates a possible reversal, which traders should consider critically. The immediate support zone identified between $90,000 and $91,000 could be a potential entry for long positions, primarily if prices begin to stabilize after a pullback in this range. For buyers, remaining alert as the volume approaches the $90,000 mark becomes essential.
Additionally, the sideways-to-bearish structure forming over the past few days necessitates vigilant monitoring of Bitcoin’s highs and lows. The price range between $96,000 and $97,000 has established itself as indecisive ground within the market. If Bitcoin manages to break above $97,500 with increased trading volume, it could signal a solid opportunity for short-term gains.
Bitcoin Trading Volume Insights and Implications
Trading volume is a key indicator for Bitcoin’s market health and overall direction. Recent decreases in volume, especially after peaking at critical price levels, have raised red flags for investors. This pattern is typical when bullish trends begin to wane, suggesting sellers could capitalize on the lack of buyer support. Understanding these dynamics can help traders adapt their strategies to manage risk effectively.
Moreover, shifting volumes often signal potential corrections or market trend changes. As the Bitcoin market trades between $96,000 and $97,000, an uptick in trading activity could indicate renewed buyer interest, allowing prices to surge past the existing resistance. Conversely, a decline below the established support range could confirm bearish sentiment and pave the way for further declines.
Forecasting Bitcoin’s Bullish and Bearish Trends
Bitcoin’s bullish trend has been robust across higher timelines. The consistent signals from major moving averages suggest that, despite short-term fluctuations, the underlying structural health remains intact. A healthy pullback is not unusual and might precede the next upward momentum. Traders focusing on long-term strategies should remain optimistic while being cautious of immediate bearish signals.
In contrast, short-term technical indicators present a more nuanced picture, highlighting increasing selling pressure. The double top formation near historical highs indicates that a correction could be imminent. As Bitcoin approaches critical support levels around $94,000 – $90,000, closely monitoring market developments will be necessary for adjusting strategies accordingly.
Traders’ Sentiment: Navigating Bitcoin’s Future Price Paths
Traders’ sentiment is crucial in predicting Bitcoin’s future price movements. The market is reflecting a blend of bullish hope and bearish caution, showcasing how mixed signals can lead to indecision among investors. The consolidation phase signals uncertainty, and traders should remain aware of emerging patterns. By gauging overall market sentiment through charts and trading volumes, they can better position themselves.
As we observe Bitcoin’s price actions in real-time, the balance between bullish attempts to reclaim significant price points and bearish pressures indicating corrections must be recognized. With the potential for Bitcoin to revisit key resistance levels, understanding polarizing trader sentiments can help predict upcoming trends more accurately.
Key Support and Resistance Levels for Bitcoin
Identifying critical support and resistance levels is vital for effective Bitcoin trading strategies. The immediate support zone, positioned between $90,000 and $91,000, represents a significant price point where buyers may step back in. Conversely, resistance is recognized around the $95,500 to $95,800 range, where sellers tend to take charge. These levels guide traders in planning their entries and exits based on market movements.
Additionally, deeper support levels around $84,000 may serve as a safety net should bearish momentum intensify. Traders should set stop-loss orders judiciously to protect against unexpected market swings. Monitoring these sectors keenly can provide strategies for maximizing profits while minimizing potential losses.
Market Volatility: Impacts on Bitcoin Price Movement
Market volatility plays a significant role in determining Bitcoin’s price trajectory. Price fluctuations can create unique trading opportunities, but they also introduce risks that traders must navigate with care. Recent trends suggest a transition to a more volatile phase, particularly with the emergence of bearish signals.
As Bitcoin faces potential downturns, understanding volatility patterns can prepare traders for abrupt changes. Strategic planning around volatility can assist in executing trades that align with market dynamics while managing risk effectively. Thus, grappling with market volatility will remain a key aspect of successful Bitcoin trading.
Understanding Bitcoin’s Short-term Technical Indicators
Short-term technical indicators provide insight into immediate price movements that shape trading strategies. The recent double top formation highlights bearish predictions, showcasing how current market sentiment is shifting toward selling rather than buying. Buyers focusing on immediate strategies must remain alert to navigate these market fluctuations.
Moreover, the bearish outlook reflected in indicators calls for cautious entry points for traders. Understanding how these indicators interplay with broader market trends can provide critical information for adjusting strategies and enhancing positioning in the ever-evolving cryptocurrency landscape.
The Role of Oscillators in Bitcoin Price Strategy
Oscillators are pivotal in assessing momentum and potential reversals in Bitcoin’s price moves. Current oscillator readings present a neutral position, suggesting that while there may be moments of buy signals, caution is essential. Traders should consider how oscillators interplay with price movements over various timeframes for a comprehensive outlook.
Leveraging oscillators can help traders identify optimal entry and exit points, particularly as Bitcoin’s market behaves unpredictably. By honing in on these metrics, traders can form a clearer view of both the immediate future and longer-term market health.
Frequently Asked Questions
What is the current Bitcoin price today and how does it affect Bitcoin price analysis?
As of now, the current Bitcoin price today is $96,101. This price plays a crucial role in Bitcoin price analysis since it reflects current market conditions, sentiment, and potential trading opportunities. Analyzing today’s price in conjunction with historical data and trading volume helps traders make informed decisions.
How does Bitcoin trading volume impact Bitcoin price analysis?
Bitcoin trading volume significantly impacts Bitcoin price analysis by indicating market activity and trader interest. Currently, the trading volume stands at $21.413 billion. A decreasing trading volume during price increases suggests weakening momentum, which traders should consider when analyzing potential price movements.
What does a Bitcoin bullish trend signify in terms of market analysis?
A Bitcoin bullish trend signifies a general upward movement in Bitcoin prices, often supported by increasing trader confidence. Despite recent fluctuations, the overall bullish sentiment remains due to rising prices from $74,434 to recent highs, informing our Bitcoin market analysis about potential future trends.
What patterns should traders watch for in Bitcoin market analysis?
In Bitcoin market analysis, traders should be vigilant for patterns such as the emerging rising wedge noted in recent analyses. This pattern may indicate potential trend reversals, and observing these patterns alongside current price levels and support zones can provide critical insights for trading decisions.
How can cryptocurrency price prediction be influenced by Bitcoin’s support levels?
Cryptocurrency price prediction can be heavily influenced by Bitcoin’s support levels, which currently lie between $90,000 and $94,500. Knowledge of these support zones helps traders anticipate potential price corrections or rebounds, thereby refining their trading strategies based on market conditions.
What do lower highs in Bitcoin price analysis suggest about market sentiment?
Lower highs in Bitcoin price analysis suggest a shifting market sentiment towards bearishness. This trend could hint at increasing selling pressure and a potential downtrend, which traders need to monitor closely for optimal buying or selling opportunities.
How can a trader capitalize on the current Bitcoin price trend?
Traders can capitalize on the current Bitcoin price trend by identifying key support and resistance levels. For example, watching for a pullback towards the $90,000–$92,000 range provides an opportunity for long entries, while also remaining vigilant about volume changes that may indicate market direction.
What technical indicators are important for Bitcoin price analysis?
Important technical indicators for Bitcoin price analysis include oscillators like momentum indicators and moving averages. Current readings suggest a neutral position, with mixed signals (sell from momentum, buy from MACD), highlighting the importance of using multiple indicators for comprehensive analysis.
What risks are present in the current Bitcoin market analysis?
Current Bitcoin market analysis reveals risks such as increasing selling pressure, particularly on 1-hour and 4-hour charts, and the potential for a deeper correction if downward momentum strengthens, emphasizing the need for caution and strategic planning.
Why is it essential to consider multiple timeframes in Bitcoin price analysis?
Considering multiple timeframes in Bitcoin price analysis is essential as it provides a comprehensive view of market trends and signals. For example, while short-term charts may indicate bearish sentiment, higher timeframe analyses suggest overall bullishness, helping traders navigate fluctuating market conditions effectively.
| Key Point | Details |
|---|---|
| Current Price | Bitcoin is trading at $96,101. |
| Market Capitalization | Bitcoin’s market cap is $1.907 trillion. |
| Trading Volume | In the last 24 hours, the trading volume was $21.413 billion. |
| Price Range | The price fluctuated between $95,944 and $97,821. |
| Support Levels | Immediate support lies between $90,000 and $91,000. |
| Resistance Levels | Potential resistance at $97,500. |
| Chart Patterns | A rising wedge pattern indicates potential reversal. |
| Trend Analysis | Short-term indicators are bearish with lower highs forming. |
Summary
Bitcoin Price Analysis highlights the increasing bearish pressure building despite the recent uptrend support. Although Bitcoin has experienced significant growth recently, signs of a potential downturn loom within the market. Traders should remain vigilant, particularly observing bullish and bearish signals as they look towards upcoming price movements. With support levels defined and the appearance of bearish patterns, the outlook remains cautious while still considering the structural bullishness observed in higher timeframes.


