Bitcoin price analysis is currently a hot topic among traders and investors as BTC shows signs of recovery after recent fluctuations. Trading at $107,059, Bitcoin’s market dynamics are pivotal in shaping future Bitcoin price predictions. With a bullish reversal taking shape on the daily chart, analysts are keenly observing BTC market trends that can provide insights into potential future movements. Furthermore, effective cryptocurrency analysis is essential for developing successful BTC trading strategies in this unpredictable market. As the digital asset continues to display resilience, understanding these patterns may offer significant opportunities for profit.
In the realm of digital currencies, evaluating Bitcoin’s price trajectory is crucial for anyone involved in the crypto space. Recent shifts, including bullish tendencies and market corrections, emphasize the importance of assessing Bitcoin’s overall performance. By applying diverse analytical methods, traders can glean valuable information to enhance their trading effectiveness. The ongoing developments in Bitcoin’s metrics provide a foundation for gauging future price movements—critical for achieving strategic objectives in cryptocurrency trading. Key factors such as support levels and resistance points must be monitored closely to navigate this evolving landscape.
Bitcoin Price Analysis: Current Market Overview
As of the latest trading data, Bitcoin price analysis indicates that the cryptocurrency is currently valued at $107,059, boasting a significant market capitalization of $2.12 trillion. The recent trading activity reflects a 24-hour volume of $27.75 billion, showcasing active participation in the market. The intraday price movement, oscillating between $105,030 and $107,219, suggests a phase of modest volatility, which is essential for investors and traders looking to capitalize on short-term fluctuations.
Notably, Bitcoin has exhibited strength in its recovery, rebounding from a recent low of $98,240. This upward movement surpassed the $106,000 mark, following a rigorous selloff phase. The formation of a bullish engulfing candle on the daily chart is indicative of a potential continuation of this upward trend. However, resistance levels close to $112,000 are critical as they might dictate the short-term direction of Bitcoin prices.
Understanding BTC Market Trends: Key Support and Resistance Levels
A comprehensive analysis of BTC market trends reveals that the cryptocurrency is not only bouncing back from recent lows but is also establishing key support and resistance levels that traders must pay attention to. The support level at $98,240 has proven resilient, providing a safety net for bullish traders. Conversely, the resistance near the $112,000 mark must be overcome for Bitcoin to confirm a sustained bullish momentum. Traders should closely monitor price action around these levels to strategize their entry and exit points.
Moreover, watching the price action is vital as it is currently forming a classic V-shaped recovery pattern on the 4-hour chart. With Bitcoin climbing from $98,240 up to $107,277, the trend indicates a healthy bullish structure characterized by higher highs and higher lows. As resistance levels come into play, market participants using BTC trading strategies may find opportunities for profit around previously established resistance that could now act as support.
Bitcoin Bullish Reversal: Analyzing Recent Performance
The concept of a bullish reversal has gained traction in recent Bitcoin price discussions following the digital asset’s notable rebound. Observing the daily chart, the emergence of a bullish engulfing candlestick pattern has significant implications, suggesting that bullish sentiment might take hold. Following a steep selloff, this reversal indicates a potential upswing in Bitcoin prices ahead, marking a positive shift for long-term holders and short-term traders alike.
To add depth to this analysis, examining the oscillators reveals mixed sentiment, which can be a precursor for sustaining the bullish reversal. The relative strength index (RSI) is still hovering around 56, indicating a neutral momentum which can quickly tilt bullish upon sustained upward price action. If volume confirms the breakout above resistance levels, the bullish reversal could lead to a more pronounced surge in Bitcoin’s value, igniting further interest and participation in the cryptocurrency realm.
Cryptocurrency Analysis: Traders Eyeing Optimal Entry Points
In the evolving landscape of cryptocurrency analysis, discerning optimal entry points is crucial for maximizing trading profits. As Bitcoin navigates its current price level, analysts identify $104,500 and $105,000 as key pullback levels that may serve as ideal entry zones. Notably, these levels previously acted as resistance, which theoretically transforms them into support during upward movements, making them attractive for traders looking to position themselves favorably.
Furthermore, the formation of a bullish flag on the 1-hour BTC/USD chart underscores an impending breakout scenario. If Bitcoin consolidates above the $106,000 threshold and breaches $107,300 with volume confirmation, traders employing BTC trading strategies could strategically place orders targeting moves toward $108,000 or even $108,500. Thus, while the landscape offers opportunities for profit, a cautious approach remains advisable, particularly if Bitcoin fails to maintain above critical support levels.
Future Bitcoin Price Prediction: What Analysts Foresee
Looking ahead, the Bitcoin price prediction landscape is showing a bullish perspective as multiple technical indicators align to support upward movement. The convergence of significant moving averages, particularly the exponential and simple moving averages across short and long-term timeframes, presents a broadly bullish outlook. This alignment not only reinforces the strength of the trend but also indicates variance in Bitcoin’s recovery trajectory, pointing toward possible highs of around $112,000 if key resistance is surpassed.
However, analysts urge caution, giving importance to the price action around pivotal levels. The sentiment among traders can shift quickly, as evidenced by the mixed readings from momentum indicators. In light of this, maintaining a watch on Bitcoin’s performance across different timeframes is essential for making astute trades that align with market trends, ensuring optimized profits over long-term investments.
BTC Trading Strategies: Navigating the Current Market
Developing effective BTC trading strategies requires a clear understanding of market trends and price movements. Currently, Bitcoin’s pattern of higher highs and higher lows suggests a feasible trading environment for both day traders and long-term investors. Utilizing strategies focused on trend-following could prove beneficial, especially as the price stabilizes above the $106,000 mark and potential entry points emerge in the established support areas.
Additionally, traders are encouraged to integrate risk management techniques within their BTC trading strategies, particularly as Bitcoin approaches resistance levels. Employing stop-loss orders below $106,000 can mitigate potential losses should the bullish structure be invalidated. As Bitcoin remains volatile, harnessing a disciplined trading approach that incorporates these strategies can facilitate successful navigation through both upward movements and market pullbacks.
Impact of Market Sentiment on Bitcoin Price Movements
Market sentiment plays a crucial role in shaping Bitcoin price movements, reflecting trader confidence and overall market psychology. As Bitcoin rallied from recent lows, the sentiment shifted positively, evidenced by increasing trading volumes and bullish candlestick formations. However, it is essential to consider that sentiment can quickly change; traders must remain vigilant about fluctuations in mood that could significantly impact price directions.
Currently, oscillators show mixed signals, suggesting that while there is bullish momentum, caution is warranted. Neutral readings from the RSI and CCI could indicate a potential plateau in price action, complicating the market narrative. Thus, understanding the underlying emotions affecting market participants can give traders an edge in predicting subsequent price movements, allowing them to capitalize effectively on potential opportunities.
Volatility in Bitcoin: Opportunities for Traders
Volatility has long been recognized as a hallmark of Bitcoin trading, offering both risk and opportunity for traders. The current market reflects modest volatility, instigated by price ranges between $105,030 and $107,219, which creates an environment ripe for active trading strategies. For skilled traders, such fluctuations present opportunities to capture short and long positions, leveraging momentum to maximize profitability.
However, with volatility comes the challenge of risk management. Traders must adopt strategies that mitigate exposure to sudden movements that could lead to significant losses. By monitoring support and resistance levels closely and utilizing short-term trading techniques, market participants can navigate through periods of volatility more effectively, thus turning potential drawbacks into advantageous situations.
Technical Analysis: Indicators Supporting Bitcoin’s Bullish Trend
In undertaking a technical analysis of Bitcoin, various indicators support the observation of a bullish trend shaping up in the near term. Key moving averages, such as the 10-period and 200-period, are currently signaling bullishness, aligning upward momentum with the overall market direction. This confluence of positive indicators across various timeframes spotlights the potential for Bitcoin to venture toward new highs, particularly looking towards resistance levels near $112,000.
Additionally, momentum indicators like the Stochastic and CCI reveal a complex narrative where bullish trends are supported by slightly bullish signals, despite some indicators hinting at possible exhaustion. This gives traders insight into the timing of their entries and exits, allowing for technically-driven trading strategies that account for potential short-term pullbacks before any further price advancements.
Analyzing Bitcoin’s Historical Context: Lessons Learned
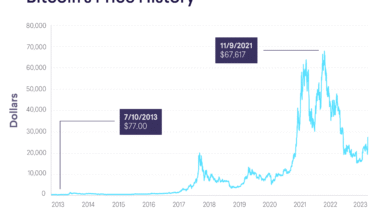
Understanding Bitcoin’s historical context provides valuable insights for current market participants. Past performance trends can reflect broader market cycles, which traders can utilize to formulate hypotheses about future movements. For instance, previous breakouts often lead to rapid price escalations, particularly when supported by robust trading volume. Drawing these connections helps traders formulate potential Bitcoin price predictions grounded in historical data.
Moreover, historical analysis highlights the importance of market sentiment, as Bitcoin’s price has previously reacted sharply to changes in trader psychology. Recognizing patterns of behavior during past bullish reversals allows traders to approach current trends with a more informed perspective, increasing their chances of navigating unpredictable price movements effectively while aligning their strategies with historical precedents.
Frequently Asked Questions
What are the key factors influencing Bitcoin price prediction today?
Recent Bitcoin price predictions suggest an upward trend influenced by market capitalization reaching $2.12 trillion and a notable rebound from a low of $98,240. Technical indicators like the bullish engulfing pattern on the daily chart and solid support at $98,240 are pivotal for forecasting BTC market trends.
How does Bitcoin price analysis indicate a bullish reversal?
Bitcoin price analysis shows a bullish reversal taking shape with a bounce from $98,240 and a current trading range indicating modest volatility. The formation of a bullish engulfing pattern and support at $106,000 further confirm the potential for upward momentum in BTC prices.
What BTC trading strategies can be applied based on current market trends?
Current BTC trading strategies include identifying optimal entry zones around $104,500–$105,000, where prior resistance has turned into support. Traders might consider scalping opportunities if Bitcoin breaches $107,300, targeting the subsequent levels between $108,000 and $108,500.
How do cryptocurrency analysis tools assess Bitcoin’s current market performance?
Cryptocurrency analysis tools utilize indicators such as moving averages, which show bullish signals, and oscillators like RSI and CCI that are mostly neutral. These insights help traders make informed decisions regarding Bitcoin’s potential bullish reversal and overall market sentiment.
What are the implications of recent Bitcoin market trends for investors?
Recent Bitcoin market trends, including a bullish outlook reinforced by moving averages and a successful bounce from lower levels, suggest potential gains for investors. However, caution is advised as neutral oscillator readings may indicate hesitancy, influencing future investment strategies.
| Key Points | Analysis |
|---|---|
| Current Price and Market Cap | Bitcoin is trading at $107,059 with a market capitalization of $2.12 trillion and 24-hour trade volume of $27.75 billion. |
| Recent Price Action | Bitcoin has rebounded from a low of $98,240, trading above $106,000. |
| Chart Patterns | Daily chart shows a bullish engulfing pattern while the 4-hour chart depicts a V-shaped recovery. |
| Support and Resistance | Support is at $98,240, while resistance is near $112,000. |
| Volume and Oscillators | Mixed sentiment indicated by oscillators; RSI at 56 and MACD shows bearish -19. |
| Moving Averages | All major moving averages support a bullish trend, highlighting both short- and long-term strength. |
| Bear and Bull Verdicts | Bullish outlook if price breaks above $107,300; bearish if it slips below $106,000. |
Summary
Bitcoin price analysis indicates a potential bullish reversal as the cryptocurrency trades at $107,059, showing signs of recovery after a significant selloff. The formation of bullish patterns on multiple timeframes supports an optimistic outlook, but investors should remain cautious regarding price action around resistance and support levels. Monitoring volume and oscillators will be crucial for confirming breakout or retracement signals.