
The topic of **Bitcoin price prediction** has gained immense traction as enthusiasts and investors seek to navigate the volatile waters of cryptocurrency investment. Various analytical tools, such as the Bitcoin Rainbow Chart and the Stock-to-Flow model, have emerged, aiming to provide insights into potential future price movements. With the BTC forecast for 2026 suggesting substantial gains, many are turning to these models to understand the factors influencing Bitcoin’s value. Observing the Bitcoin halving impact and its correlation with price surges, analysts are eager to determine whether these forecasts hold true this time. As we dive into the intricacies of cryptocurrency price models, it becomes clear that, while predictions are pivotal, they must be considered alongside market dynamics and historical data.
As digital currencies evolve, the discourse surrounding **Bitcoin price forecasts** intensifies, prompting analysts and investors to explore various predictive frameworks. Terms like Bitcoin’s future trajectory and the potential outcomes by 2026 come into focus, particularly with tools such as the Rainbow Bands and Stock-to-Flow chart shaping discussions. These resources are designed to illustrate Bitcoin’s growth patterns and the impact of scarcity, especially following halving events that historically provoke price rallies. The anticipation surrounding Bitcoin’s next price movements is further fueled by market sentiment and behavioral economics, making the search for accurate predictions both thrilling and precarious. Ultimately, understanding the various methodologies for forecasting Bitcoin’s shift in value is essential for making informed investment decisions.
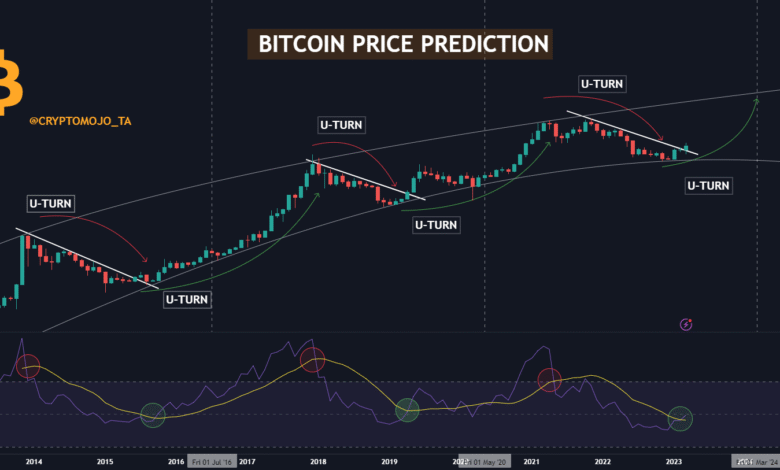
Bitcoin Price Prediction: Analyzing the Future of BTC
As the cryptocurrency landscape evolves, Bitcoin price prediction has become a focal point for both investors and analysts alike. With Bitcoin’s current trading price at approximately $103,046 and projections suggesting a potential rise to $275,000 by 2026, understanding the factors driving these predictions is crucial. Analysts utilize various tools such as the Rainbow Chart and the Stock-to-Flow (S2F) model to assess Bitcoin’s future value. These models offer insights into Bitcoin’s scarcity and historical performance which influence price forecasts.
For instance, the Stock-to-Flow model asserts that Bitcoin’s programmed scarcity, due to its halving events every four years, significantly impacts its price trajectory. Post-halving periods often witness notable price growth, propelling Bitcoin towards predicted highs. Conversely, the Rainbow Chart visually represents Bitcoin’s potential price movement through various market sentiment zones, and indications suggest a future crossing into the speculative territory beyond $100,000. Together, these methodologies create a narrative around Bitcoin’s potential, providing a robust basis for its keeping value predictions.
Understanding the Stock-to-Flow Model and Its Impact on Bitcoin
The Stock-to-Flow (S2F) model highlights the relationship between Bitcoin’s scarcity and its market value, providing a framework to evaluate potential price movements. This model considers Bitcoin’s ‘stock’—the total supply of coins currently in circulation—and ‘flow,’ which refers to the number of new coins mined each year. Following a halving event, the flow is reduced, thereby increasing scarcity and theoretically driving prices higher. Since Bitcoin’s last halving occurred a year ago, many investors are keen to observe the price action that aligns with historical S2F projections.
Recent analyses have indicated that Bitcoin’s market price is tracking closely to S2F predictions, with a target of $275,000 by late 2026. This reinforces the argument that scarcity contributes to prolonged price increases. However, it’s essential to note that while the S2F model has gained traction, it is not without limitations. Market fluctuations due to external factors, such as economic crises or regulatory changes, could significantly alter the forecasted trajectory, warranting a cautious approach when relying solely on this model for making trading decisions.
Exploring the Insights of the Bitcoin Rainbow Chart
The Bitcoin Rainbow Chart provides a visual representation of its price evolution, suggesting it will likely progress from the ‘FOMO’ band towards the ‘Is this a Bubble?’ zone in the coming months. By adhering to the logarithmic growth trend depicted in the chart, analysts speculate that Bitcoin could reach between $290,000 and $365,000 by late 2026. Notably, each colored band reflects different levels of market sentiment regarding Bitcoin’s value, assisting traders in gauging whether current prices are a good entry point or overly speculative.
It’s important to recognize that while the Rainbow Chart is a helpful tool for long-term forecasting, it’s not conceived as a stand-alone predictor. Modifications over time have improved its predictive power, but criticism still persists regarding its empirical reliability. Therefore, successful investors should integrate insights from the Rainbow Chart in conjunction with other analytical models like S2F for a more nuanced understanding of Bitcoin’s price dynamics, thereby mitigating the risks associated with over-reliance on any single predictive model.
Navigating the Complexity of Cryptocurrency Price Models
In the realm of cryptocurrency, various price models coalesce to provide a comprehensive view of potential market movements. The juxtaposition of the Rainbow Chart and the Stock-to-Flow model exemplifies the diverse analytical approaches available to investors. Each tool possesses unique strengths—while the S2F model encapsulates the concept of scarcity, the Rainbow Chart illustrates market sentiment trends. By employing both models, traders can construct a more holistic strategy for predicting Bitcoin’s future pricing.
Despite their usefulness, cryptocurrency price models must be approached with vigilance. Market inefficiencies and external events—like regulatory shifts or macroeconomic disruptions—can drastically influence Bitcoin’s price. Therefore, embracing a versatile toolkit that encompasses these models alongside traditional financial analyses allows investors to navigate the turbulence of crypto markets more effectively. By understanding the limitations and capabilities of each model, traders can make informed decisions and align their strategies with broader market dynamics.
The Role of Bitcoin Halving in Price Predictions
Bitcoin halving events play a pivotal role in shaping market expectations and driving price predictions. Occurring every four years, these events reduce the mining reward by half, curbing the rate at which new bitcoins are introduced into the supply. The immediate effect is an increase in scarcity, one of the core factors underpinning the bullish forecasts articulated by both the Stock-to-Flow model and the Rainbow Chart. Notably, historical trends suggest that price rallies often materialize in the 12 to 18 months following a halving event, reinforcing the notion that Bitcoin is approaching another critical phase in its valuation.
As analysts delve deeper into the implications of halving, the anticipation surrounding these events exacerbates market activity leading up to them. This excitement often translates into price surges, as traders speculate on potential gains. However, it’s essential to recognize that while historical patterns provide guidance, the dynamics of the current market environment may diverge significantly from past behaviors. Consequently, investors should be wary of purely extrapolating previous trends without considering contemporary factors that could influence Bitcoin’s path.
Investor Psychology: The Heart of Bitcoin Valuation Dynamics
Understanding investor psychology constitutes an integral aspect of Bitcoin price prediction and market behavior. The sentiment in the cryptocurrency space can drive rapid price movements, often influenced by news cycles, social media trends, and broader economic indicators. As Bitcoin navigates through various sentiment levels—as depicted in the Rainbow Chart—it’s vital for investors to comprehend the potential for volatility stemming from collective decision-making and emotional responses within the trading community.
Effective analysis requires more than a mere assessment of technical indicators or predictive models; embracing the nuances of market psychology will yield a more rounded view of Bitcoin’s prospects. Investors must cultivate the ability to read sentiment shifts, identifying points of irrational exuberance or fear that could radically alter market dynamics. This comprehension of psychological factors, when integrated with quantitative models like S2F and the Rainbow Chart, enhances predictive accuracy and strategic positioning in a notoriously volatile market.
Combining Technical Analysis with Market Insights
The intersection of technical analysis, such as those provided by the Rainbow Chart and Stock-to-Flow model, and broader market insights creates a robust foundation for understanding Bitcoin’s trajectory. Engaging with a diverse array of forecasting tools allows traders to triangulate their strategies and anticipate price movements more accurately. This blend of quantitative modeling and qualitative analysis enables investors to navigate the complexities of the crypto market landscape.
Moreover, by continuously learning from historical trends while remaining adaptable to changing market conditions, traders can make more informed decisions. Integrating multiple analytical frameworks—whether through traditional financial techniques or emerging on-chain metrics—helps refine predictions and manage risks. Ultimately, having a comprehensive approach is crucial, as Bitcoin’s path often defies easy categorization, demanding both analytical rigor and conceptual flexibility.
The Future of Bitcoin: Are Predictions Realistic?
Given the optimistic Bitcoin price predictions being circulated, one must question the realism of forecasts such as the anticipated $275,000 price point by 2026. While analytical frameworks such as the Stock-to-Flow model and the Rainbow Chart present compelling narratives, it is essential to weigh these against the unpredictable nature of the cryptocurrency market. Factors like regulatory changes, macroeconomic trends, and technological shifts can, and often do, alter market forecasts considerably.
Conclusively, while models provide valuable insights, they should not serve as definitive guides. History has shown that crypto markets can react unpredictably to external stimuli, leading to significant deviations from predicted price levels. Therefore, investors should uphold a balanced outlook, maintaining skepticism towards overly bullish predictions while also preparing for potential volatility, which is an inherent characteristic of the cryptocurrency ecosystem.
The Importance of Continuous Evaluation in Crypto Forecasts
As the cryptocurrency market continually evolves, so too must the evaluation of models and predictions. Analysts and investors should engage in periodic reassessments of the frameworks they employ to ensure they are reflective of current market conditions. This means regularly revisiting the methodology behind tools like the S2F and Rainbow Chart, and tweaking them to counteract any biases or inaccuracies that may arise with new data or market behaviors.
Additionally, fostering a culture of critical thinking around these predictions can bolster an investor’s resilience against the inevitable uncertainties of the market. This critical lens should encompass the integration of various analytical techniques alongside a staunch understanding of market sentiment and investor behavior. In doing so, participants in the crypto space can make better-informed decisions and maintain flexibility in their strategies as new information and trends emerge.
Frequently Asked Questions
What is the Bitcoin price prediction using the Stock-to-Flow model for 2026?
The Stock-to-Flow (S2F) model suggests that Bitcoin could reach approximately $275,000 by late 2026. This prediction is based on the model’s assessment of Bitcoin’s scarcity, which increases with each halving event that occurs every four years, thereby exerting upward pressure on prices.
How does the Bitcoin Rainbow Chart influence price predictions?
The Bitcoin Rainbow Chart indicates that Bitcoin’s price may ascend from the ‘FOMO’ band to the ‘Is this a Bubble?’ zone within the next 18 months, potentially reaching a target range of $290,000 to $365,000 by late 2026. This chart represents long-term logarithmic growth and incorporates historical data to forecast future price movements.
What impact does Bitcoin halving have on price predictions?
Bitcoin halving events, which occur every four years, significantly impact price predictions by reducing the flow of new coins being mined. This increased scarcity is expected to push prices higher, facilitating bullish forecasts like those from the Stock-to-Flow model, which targets around $275,000 by 2026.
Can the Rainbow Chart and S2F model be relied upon for accurate Bitcoin price forecasting?
While both the Rainbow Chart and the Stock-to-Flow model are useful tools for Bitcoin price forecasting, they should not be solely relied upon. Market dynamics, regulatory changes, and investor sentiment should also be considered, as these models have their limitations and have faced criticism regarding empirical verification.
What are the benefits of using cryptocurrency price models like the S2F?
Cryptocurrency price models like the Stock-to-Flow model provide a framework to analyze Bitcoin’s price based on its scarcity. They offer insights into potential future price movements, making them beneficial for investors seeking to understand market trajectories and make informed decisions amidst volatility.
How do analysts use the Bitcoin Rainbow Chart for forecasting?
Analysts utilize the Bitcoin Rainbow Chart to visualize Bitcoin’s long-term price growth and sentiment trends. By interpreting the colored bands, they can identify potential price thresholds and gauge investor psychology, assisting in setting realistic expectations for future Bitcoin valuations.
What is the relationship between Bitcoin’s price and its halving events according to the S2F model?
According to the Stock-to-Flow model, each Bitcoin halving event leads to a reduction in the flow of new Bitcoin being produced, increasing its scarcity. This enhanced scarcity aligns with historical price rallies following halvings, suggesting potential for significant price increases in the months after these events.
Are there any risks associated with relying on Bitcoin price predictions from these models?
Yes, there are inherent risks in relying solely on Bitcoin price prediction models like the Rainbow Chart and S2F. These models may not account for sudden market shocks, macroeconomic conditions, or changes in regulatory environments, which can dramatically influence actual market outcomes.
| Key Point | Details |
|---|---|
| Current Bitcoin Price | As of May 9, 2023, Bitcoin (BTC) was trading at $103,046. |
| S2F Model Insights | The S2F model predicts Bitcoin could reach $275,000 by late 2026 based on historical scarcity trends. |
| Rainbow Chart Predictions | The Rainbow Chart suggests a price range of $290,000–$365,000 by late 2026. |
| Analyzing Models’ Limitations | Both S2F and Rainbow Charts should be used with caution, considering external factors and market dynamics. |
| Market Conditions Awareness | Investors should consider liquidity shifts and regulatory changes for a nuanced understanding of Bitcoin price movements. |
Summary
Bitcoin price prediction remains a topic of significant interest among investors, especially with expectations of explosive growth driven by models like the S2F and Rainbow Chart. While optimistic projections suggest that Bitcoin could reach between $275,000 to $365,000 by late 2026, it is essential to remember that these models are not infallible. Market conditions, regulatory landscapes, and investor psychology significantly influence price movements. Hence, while the predictions are enticing, they should be approached with a critical mindset and consideration of the broader economic environment.


