Cardano Price Analysis: Key Resistance Levels to Watch

Cardano price analysis reveals a critical moment for ADA as it has recently experienced a significant correction, testing the 800-day EMA. After falling to this key support level, the cryptocurrency briefly paused its decline, indicating the potential for stabilization. However, traders remain watchful as the 50-day EMA and 200-day EMA serve as formidable resistance levels that must be overcome for a bullish trend to establish. The current price action suggests that while ADA is finding footing, the pathway toward higher price targets is fraught with obstacles. As activity around the $0.85 area heats up, the implications for crypto trading strategies hinge on Cardano’s ability to navigate these technical hurdles effectively.
In examining the recent fluctuations of Cardano, one can observe the underlying market dynamics surrounding ADA. The recent price movements signify a major correction phase as traders assess critical support and resistance levels, notably around the frequently referenced moving averages. Understanding these shifts in price behavior aids in crafting effective trading strategies in the ever-evolving crypto space. Additionally, the analysis suggests that market participants monitor liquidity zones closely, particularly where historical price actions influence future results. This comprehensive overview aims to equip investors with insights essential for navigating Cardano’s complex trading landscape.
Understanding Cardano Price Analysis
In recent trading days, Cardano (ADA) has faced a notable correction, plunging to the significant 800-day EMA, which has historically served as a critical support level. This dynamic average offers traders insights into potential support and resistance zones that shape crypto trading strategies. As we analyze Cardano’s price movements, it is essential to consider factors such as market sentiment, trading volume, and broader cryptocurrency trends that define ADA’s trajectory. With the price exhibiting initial signs of stabilization, investors are watching closely for any signals indicating a reversal or further decline.
Further examination reveals that the closure of the green vector candle from May 22 holds technical importance, marking a target that has now been achieved. As Cardano navigates its current price range, the behavior of the 50-day and 200-day EMAs will be instrumental in determining resistance levels. A persistent challenge at these critical moving averages suggests that any upward momentum may require substantial buying pressure to overcome these barriers effectively.
Frequently Asked Questions
What can we learn from the recent Cardano price analysis regarding the ADA correction?
The latest Cardano price analysis indicates a significant correction that has seen ADA drop to the 800-day EMA, which acted as a support level. This correction highlights crucial trading opportunities as traders analyze the potential for recovery.
How do ADA resistance levels impact the Cardano price analysis?
In the current Cardano price analysis, the ADA resistance levels, specifically the 50-day EMA and the 200-day EMA, are key factors. These moving averages represent significant barriers that must be overcome for a bullish trend to establish, making them essential points of focus for traders.
What are effective crypto trading strategies in light of the Cardano price analysis?
Based on the Cardano price analysis, effective crypto trading strategies might involve monitoring the stability around the 800-day EMA and preparing for potential price movements upon breach of resistance levels. Utilizing these insights can help inform trading decisions.
How does the Cardano EMA affect price predictions?
The Cardano EMA plays a critical role in price predictions. The 200-day and 50-day EMAs currently present resistance and, should ADA manage to break through these levels, it could indicate a promising price rally in the near future.
What is the projected ADA price target according to recent Cardano price analysis?
The projected ADA price target, as noted in the recent Cardano price analysis, is around $0.85. This zone represents a magnetic price target due to volume profile factors and historical accumulation, suggesting potential volatility.
What should traders watch for in Cardano price analysis moving forward?
Traders should closely monitor the Cardano price analysis for reactions to key moving averages, particularly the 50 EMA and 200 EMA. Breakthroughs at these levels could signal new momentum as ADA navigates through resistance.
Why is the magnetic price target around $0.85 significant in Cardano’s price analysis?
The significance of the magnetic price target around $0.85 in Cardano’s price analysis stems from its role in historical accumulation and stop orders. This price level is likely to create substantial trading activity and potential volatility when approached.
What indicators can enhance the understanding of Cardano price analysis?
In studying Cardano price analysis, technical indicators such as EMAs and volume profiles can enhance understanding. They help traders identify support and resistance levels and gauge market sentiment for more informed trading decisions.
How might short-term pullbacks affect Cardano price analysis?
Short-term pullbacks can significantly affect Cardano price analysis by introducing increased volatility and testing support levels like the 50 EMA. Observing these pullbacks is crucial for anticipating potential price recoveries or further declines.
What overall trends does the Cardano price analysis suggest for traders?
The overall trends suggested by the Cardano price analysis indicate a potential recovery but with notable resistances. Traders should prepare for both upward momentum if resistances are overcome and potential pullbacks to support levels.
| Key Point | Description |
|---|---|
| Recent Price Correction | Cardano (ADA) has recently experienced a significant correction, dropping to the 800-day EMA which has served as a dynamic support level. |
| Green Vector Candle | The green vector candle from May 22 was fully closed, which is a significant technical marker that has been addressed. |
| Stabilization Signs | There are signs of stabilization at the current price range, indicating the possibility of a reversal. |
| Resistance Levels | The 50-day EMA and 200-day EMA will present significant resistance to upward movement, indicating a challenging path ahead. |
| Target Price Zone | The $0.85 area is a price target of interest due to its historical accumulation and potential volatility surrounding stop orders. |
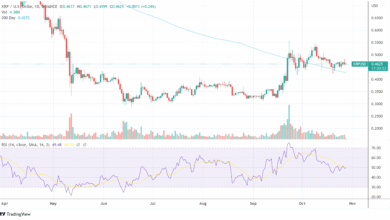
| 4-Hour Chart Insights | The 4-hour chart shows ADA is struggling against resistance levels, with the 200 and 800 EMAs highlighting necessary barriers to overcome. |
| Long Position Dynamics | There has been an increase in long positions, with long volume significantly outweighing short positions, which may affect market liquidity. |
| Technical Outlook | The overall technical situation suggests potential recovery but warns of short-term pullbacks due to the current market dynamics. |
Summary
Cardano price analysis indicates that the cryptocurrency is at a critical juncture following a substantial correction. The price sits at the 800-day EMA, which has provided some support. While there are early signs of stabilization, significant resistances at the 50-day and 200-day EMAs must be navigated carefully. The $0.85 area remains a pivotal price target, suggesting heightened volatility. The 4-hour chart reinforces this view with long positions increasing, potentially leading to liquidity challenges. The upcoming reactions to these key moving averages will determine the next notable price movements in ADA.


