In the ever-evolving landscape of cryptocurrency trading, Dogecoin price analysis reveals intriguing market dynamics as it showcases a consolidation phase around the crucial 50-day EMA. Trading just above the resistance level of $0.185, Dogecoin has sparked speculation about the potential for a breakout or further decline. Technical indicators, including the RSI and MACD, signal that this may not be a straightforward upward trend after all. As critical price movements draw nearer, investors keenly observe the intersection of Dogecoin’s price with Bitcoin, recognizing its direct impact on market behavior. This analysis aims to unpack these complex layers, providing insights into what lies ahead for Dogecoin enthusiasts and traders alike.
When examining the recent shifts in Dogecoin’s valuation, it becomes essential to assess the overall trend within the realm of digital currencies. Scrutinizing the current price movements reveals a consolidation period that may precede a significant price breakout. The interplay between technical signals and market sentiment, particularly associated with Bitcoin’s fluctuations, can heavily influence Dogecoin’s trajectory. Understanding these correlations not only sheds light on potential trading strategies but also emphasizes the importance of aware engagement in the encrypted financial world. As we delve deeper into the fundamentals of Dogecoin’s pricing, recognizing its distinctive characteristics will set the stage for informed investment decisions.
Current Dogecoin Price Analysis
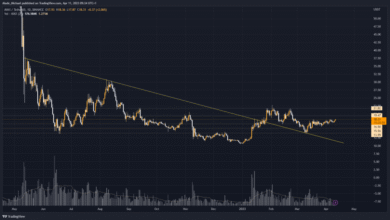
As of the latest analysis, Dogecoin is experiencing a consolidation phase, having settled around the critical 50-day EMA. This positioning places the asset just above the significant resistance level of $0.185, which has shown potential weakness in the recent upward trend. The ongoing consolidation may signal a period of indecision among traders, who are watching closely for signs of strength or weakness in the price action. If Dogecoin’s price fails to hold above this support level, it may increase the chances of a retracement back towards lower levels, particularly if renewed selling pressure emerges.
With Dogecoin hovering around this psychological level, traders should pay close attention to the wider cryptocurrency trading environment and key technical indicators. The heatmap analysis indicates heightened liquidity at the $0.185 mark, suggesting that a reversal could occur if past price action is any guide. A clear rejection at this level previously signals caution; thus, market participants need to prepare for potential volatility that could come from a bullish or bearish breakout.
Technical Indicators and Their Implications
Evaluating the technical indicators for Dogecoin reveals a mixed outlook. Currently, the Relative Strength Index (RSI) is positioned in the neutral zone, signaling a lack of definitive momentum either for buying or selling decisively. Coupled with the MACD showing diminishing positive momentum, this paints a picture of a potentially weakening upward trend. For traders, this scenario necessitates close monitoring; a loss of support from the 50-day EMA could lead to a significant decline and prompt a move towards the longer-term 800-day EMA.
Additionally, dogecoin traders should consider the impact of Bitcoin’s market fluctuations on Dogecoin’s price action. Historically, Dogecoin has shown a close correlation with Bitcoin, meaning that substantial movements in Bitcoin’s price can directly influence sentiment around Dogecoin. Thus, any breakout or bullish sentiment in Bitcoin should be closely watched, as it could provide a catalyst for upward movement in Dogecoin.
Breakout Potential in Dogecoin’s 4-Hour Chart
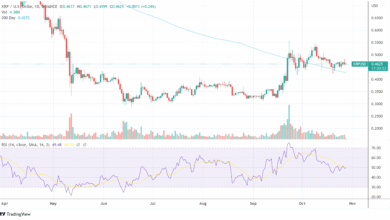
On the 4-hour chart, Dogecoin is presenting a more optimistic scenario as it shows signs of preparing for a possible bullish breakout. The ongoing consolidation above the 50-day EMA creates a favorable environment for a potential upward movement, particularly if the price manages to breach the diagonal resistance line highlighted in analysis. With Dogecoin frequently testing the 50-day EMA, this dynamic support level will be critical to maintain if traders are to see a breakout confirmed.
Moreover, the technical indicators on this timeframe lend credence to the possibility of a breakout. The RSI sitting above the 50 level indicates that bullish momentum could be sustaining, while the MACD’s bullish divergence suggests a shift towards positive price movement. If Dogecoin can decisively break through the resistance line with increased trading volume, it could signal the start of a significant upward trend, a scenario that many traders would welcome for stronger gains.
The Role of Bitcoin in Dogecoin’s Price Movement
Understanding the dynamic between Bitcoin and Dogecoin is crucial for traders looking to capitalize on both coins. Bitcoin’s market movements often set the tone for the entire cryptocurrency market. As Dogecoin maintains a close correlation with Bitcoin, any significant breakout or decline in Bitcoin can directly influence Dogecoin’s price trajectory. Consequently, keeping an eye on Bitcoin trends is essential for predicting potential shifts in Dogecoin’s market behavior.
For example, in times of bullish momentum for Bitcoin, Dogecoin often receives a boost as the market sentiment drifts towards altcoins, with traders seeking to diversify their portfolios. Conversely, when Bitcoin experiences corrections or bearish phases, Dogecoin may reflect that negativity, leading to decreased interest and increased selling pressure. Therefore, integrating Bitcoin’s performance analysis into Dogecoin trading strategies is indispensable for anticipating price movements and managing risks effectively.
Understanding Dogecoin Consolidation Phases
Consolidation phases are vital periods for any asset, including Dogecoin, where the price tends to move sideways before making a significant move either upward or downward. During this time, Dogecoin appears to be stabilized around key technical levels, particularly the 50-day EMA and the resistance region at $0.185. This time of stability can attract traders looking for clear signs of direction, which adds liquidity to this phase.
The consolidation phase can also serve as a breeding ground for potential breakouts or breakdowns. Traders use various indicators to assess whether Dogecoin is gearing for a breakout. For instance, if the price continually respects the 50-day EMA as support during this consolidation, it may signal a strong bullish sentiment brewing beneath the surface. Ultimately, recognizing these phases can provide traders with an edge in their strategies, allowing them to position themselves advantageously before significant price changes.
Impacts of Market Sentiment on Dogecoin
Market sentiment plays an integral role in determining the direction of Dogecoin’s price, particularly during its consolidation or breakout phases. The mood of traders, driven by news events, Bitcoin’s price shifts, and overall market conditions, can lead to significant volatility in how Dogecoin behaves. For example, positive sentiment around cryptocurrencies can result in the influx of buying pressure, while negative news could spur selling and panic reactions.
Additionally, fluctuations in investor confidence often lead to rapid price movements, as seen in various asset classes. Attention on Dogecoin can spike following social media trends or influencer endorsements, which highlights the importance of not just technical analysis but also social dynamics. Understanding the interplay between market sentiment and hard data is essential for traders aiming to navigate the complexities of Dogecoin’s price movements effectively.
Analyzing Liquidity and Selling Pressure in Dogecoin
Liquidity is a critical factor for traders operating in the Dogecoin market, especially around key price levels like $0.185. The heatmap indicates substantial liquidity in this area, meaning that a significant number of buy and sell orders await execution. This level of liquidity can amplify price swings during times of high volatility as traders look to enter or exit positions.
Moreover, recognizing levels of potential selling pressure can help inform trading strategies. If Dogecoin’s price approaches the $0.185 area, traders should be vigilant as previous resistance may reverse, initiating selling sentiment. Maintaining awareness of these liquidity parameters can assist traders in making timely decisions that align with market conditions.
The Importance of Volume in Dogecoin Price Movements
Volume is a paramount metric in cryptocurrency trading and can heavily influence Dogecoin’s price action. Increased trading volume often accompanies breakout scenarios, signaling strong conviction among traders in the direction of price movement. For Dogecoin, watching for a surge in volume as it approaches resistance levels can provide confirmations for potential breakout scenarios, lending weight to the bullish narrative if accompanied by decisive price action.
Conversely, low volume can lead to price stagnation and increased susceptibility to erratic price movements. In times of consolidation, volume analysis becomes crucial in gauging whether Dogecoin is likely to break out or reverse. A robust increase in volume following a price surge could indicate sustained interest and momentum, vital for traders seeking to capitalize on upward trends.
Long-Term Outlook for Dogecoin Investors
While short-term trading strategies may focus on immediate price movements, long-term investors in Dogecoin should consider the overall market fundamentals and technological developments surrounding the cryptocurrency. Dogecoin’s position as a widely recognized meme coin creates unique opportunities, as renewed interest can lead to price surges driven by community engagement and media attention. However, the influence of Bitcoin must always be considered in long-term projections, given its primary position in the crypto market.
Investors should also factor in the overall evolution of the crypto space, including regulatory developments and competing altcoins that may alter Dogecoin’s market position. Long-term holders may benefit from a strategy that combines technical analysis with an understanding of fundamental drivers for growth, ensuring alignment with the broader market trends as Dogecoin navigates its path forward.
Frequently Asked Questions
What is the current Dogecoin price analysis based on consolidation patterns?
Dogecoin is currently in a consolidation phase on the daily chart, trading around the 50-day EMA and just above the resistance level at $0.185. This area previously acted as resistance, suggesting potential weakness in the upward trend and the possibility of renewed selling pressure.
How do technical indicators affect Dogecoin price analysis?
In the current Dogecoin price analysis, technical indicators like the RSI and MACD are not indicating a strong bullish scenario. The RSI is neutral, and the MACD shows diminishing positive momentum. This suggests that a correction may occur if Dogecoin loses support at the 50-day EMA.
What role does Bitcoin play in Dogecoin price analysis?
Bitcoin’s movements have a significant impact on Dogecoin price analysis. A substantial breakout or decline in Bitcoin is likely to directly influence Dogecoin’s price development, making it essential to monitor Bitcoin for insights on potential price movements for DOGE.
Is Dogecoin preparing for a breakout based on the 4-hour chart analysis?
Yes, the 4-hour chart shows Dogecoin in a constructive technical structure, with repeated tests of the 50-day EMA providing dynamic support. A breakout above the downward-sloping diagonal resistance line could be imminent, confirming a short-term bullish scenario.
What are the indicators signaling for Dogecoin’s potential breakout?
The 4-hour technical indicators are showing supportive signals for Dogecoin’s potential breakout. The RSI is above 50, indicating upward momentum, while the MACD exhibits signs of bullish divergence. If DOGE breaks the diagonal resistance line with rising volume, it may trigger a significant upward move.
How important is liquidity in Dogecoin price analysis?
Liquidity plays a critical role in Dogecoin price analysis. The heatmap indicates increased liquidity around the $0.185 level, suggesting that if Dogecoin price rises back to this level, renewed selling pressure may emerge, potentially leading to a reversal in price action.
What should traders watch for in Dogecoin’s price development?
Traders should focus on potential support at the 50-day EMA and resistance levels, as well as Bitcoin’s performance, as it could influence Dogecoin’s price dynamics. Monitoring technical indicators and volume patterns will also be crucial for identifying breakout opportunities.
How can Dogecoin consolidation patterns indicate future price movements?
Dogecoin consolidation patterns can signal future price movements by revealing market sentiment and potential reversals. If Dogecoin sustains above the 50-day EMA and manages to break resistance, it may indicate a bullish trend; failure to hold this level could lead to a decline.
| Key Point | Details |
|---|---|
| Current Price Action | Dogecoin is in a consolidation phase, trading above $0.185 resistance. |
| Resistance Levels | $0.185 has recently acted as resistance, indicating potential weakness in upward trends. |
| Technical Indicators | RSI is neutral; MACD shows diminishing positive momentum, indicating a weakening trend. |
| Support Levels | 50-day EMA is crucial support; a loss could lead to a deeper retracement. |
| 4-Hour Chart Analysis | Constructive structure with potential for a breakout; RSI above 50 shows momentum. |
| Market Sentiment | Bitcoin’s movement significantly impacts Dogecoin’s price development. |
Summary
Dogecoin price analysis reveals a current consolidation phase, where the price is hovering just above the resistance level of $0.185. This period indicates potential weakness in the upward trend, as technical indicators such as the RSI and MACD do not support strong bullish movements. However, on the 4-hour chart, Dogecoin displays constructive signals with a possible breakout forming, contingent on sustained support from the 50-day EMA. Overall, the direction of Bitcoin will remain a crucial factor in any forthcoming price adjustments for Dogecoin.