Fibonacci retracement in Bitcoin trading is a powerful tool used by traders to identify potential reversal points and price levels within the volatile cryptocurrency market. By analyzing key Fibonacci levels, such as 23.6%, 38.2%, and the significant 61.8%, traders can develop effective Bitcoin trading strategies that enhance their decision-making process. These levels serve as crucial indicators, allowing traders to apply technical analysis tools that pinpoint ideal entry and exit points. Understanding the differences between retracement and reversal is essential for maximizing trading success; knowing when the market is merely pulling back or shifting direction can mean the difference between profit and loss. As Bitcoin continues to fluctuate, mastering Fibonacci retracement can provide a structured approach to navigating market uncertainties.
In the realm of cryptocurrency trading, particularly Bitcoin, traders often turn to Fibonacci analysis as a means to gauge potential market movements. This method revolves around specific percentages derived from the Fibonacci sequence, which help in establishing critical support and resistance levels. Utilizing Fibonacci ratios can significantly amplify the effectiveness of trading strategies, enabling participants to capitalize on price fluctuations. The distinction between temporary pullbacks and significant market reversals plays a crucial role in determining trading outcomes. By incorporating Fibonacci extensions alongside retracement techniques, traders can more accurately predict future price targets, making it an indispensable element in the toolkit of modern traders.
Understanding Fibonacci Levels in Bitcoin Trading
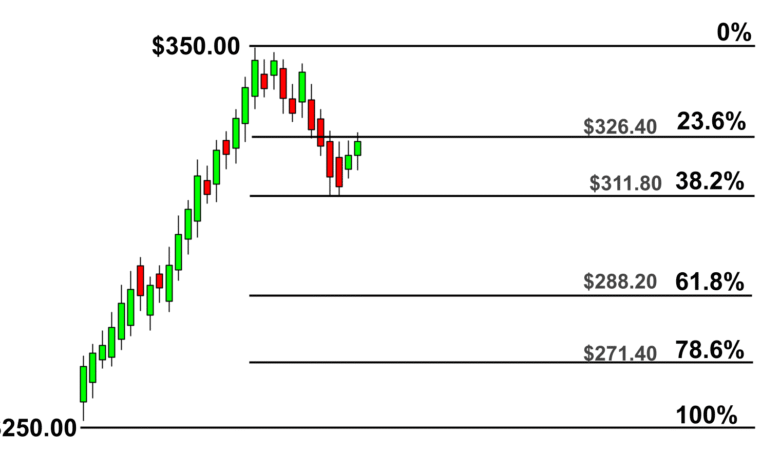
Fibonacci levels are crucial indicators in technical analysis that traders use to identify potential support and resistance zones in the volatile bitcoin market. These levels emerge from the Fibonacci sequence, where key ratios such as 23.6%, 38.2%, 61.8%, and 78.6% help traders pinpoint retracement areas when analyzing Bitcoin price movements. In the context of Bitcoin trading strategies, these levels provide traders with actionable insights, enabling them to make informed decisions about entry and exit points.
Understanding how Fibonacci levels operate can significantly impact a trader’s performance. For instance, when Bitcoin prices rise sharply, determining the most likely retracement level can help anticipate price pullbacks. Many traders often look to the 61.8% Fibonacci level as it has historically shown strong relevance in supporting price action. By aligning their strategies with these Fibonacci levels, traders can increase their chances of capitalizing on market trends effectively.
Incorporating Fibonacci Retracement in Bitcoin Analysis
When it comes to technical analysis tools, Fibonacci retracement is among the most effective for analyzing Bitcoin charts. By drawing Fibonacci levels from a recent high to a low, traders can visualize potential reversal points, adding a systematic approach to their trading. For example, after a bullish trend, if Bitcoin starts to decline, traders might draw Fibonacci retracement lines to assess where the price might consolidate or bounce back. This analysis is vital as understanding these potential reversal zones can lead to enhanced profitability.
Moreover, the effectiveness of Fibonacci retracement is augmented when combined with other indicators. For instance, a trader may notice that Bitcoin retracing to the 38.2% Fibonacci level coincides with a bullish divergence in the RSI. Such confluence of indicators provides additional confirmation of the trade setup, reinforcing the trader’s confidence in executing entry orders at these critical levels. This melding of technical tools illustrates how Fibonacci retracement becomes not merely a standalone tool but rather part of a comprehensive trading strategy.
The Importance of the Golden Ratio in Bitcoin Trading
The significance of the 61.8% Fibonacci level, known as the golden ratio, cannot be overstated in the context of bitcoin trading. Historically, this level has demonstrated a propensity to act as a strong support or resistance zone, dictated by market psychology. Traders often witness price action that reacts vigorously when touching this level. Therefore, identifying the 61.8% ratio when setting up trades offers traders a psychological edge as this level frequently attracts substantial buy or sell interest.
Additionally, the golden ratio’s appeal lies in its manifestation across various fields—natural phenomena, architecture, and, notably, financial markets. In Bitcoin trading, a price bounce at the 61.8% level can be deemed a bullish signal, confirming that the market respects the Fibonacci sequence’s mathematical foundations. This level, reinforced by other technical indicators like trend lines or moving averages, can emerge as a tactical zone for executing trades and managing risk effectively.
Combining Fibonacci Retracement with Other Indicators
Combining Fibonacci retracement with other technical analysis tools such as the RSI or MACD can significantly bolster a trader’s strategy. For instance, if Bitcoin retraces to the 50% level while the RSI indicates oversold conditions, this presents a strong buying opportunity. Moreover, using volume analysis in conjunction with Fibonacci levels allows traders to evaluate the strength of the price movements and the likelihood of successful reversals, making trading decisions more informed.
Traders seeking to refine their approach can also consider candlestick patterns in combination with Fibonacci retracement levels. For example, should Bitcoin pull back to the 38.2% level, a bullish engulfing pattern may signal an imminent uptrend. This multifaceted approach to technical analysis not only enhances the accuracy of trade setups but also reinforces a trader’s conviction in their strategy, making the use of Fibonacci retracement a fundamental component of successful market engagement.
Differentiating Between Retracement and Reversal
Distinguishing between a retracement and a reversal is pivotal in bitcoin trading. A retracement allows traders to capitalize on temporary market corrections within a larger trend, while a reversal signifies a fundamental change in market direction. Using Fibonacci retracement helps identify the nature of price movements, wherein levels such as 38.2% or 50% can signify temporary pullbacks rather than the start of a new trend.
If Bitcoin retraces to the 50% level and resumes its upward momentum, it is likely that the price action is merely a retracement. In contrast, if it fails to hold these crucial Fibonacci levels and shows signs of weakening volume, traders may interpret this as a potential reversal signal, necessitating a reassessment of market positions. The clear demarcation between these two scenarios is essential for successful trading outcomes.
Utilizing Fibonacci Extensions for Predicting Future Moves
Fibonacci extensions serve as invaluable tools for forecasting potential price targets in trending bitcoin markets. Unlike retracements, extensions project beyond current levels to identify resistance points. Traders can utilize previous high and low prices to establish Fibonacci extension levels, like the 161.8% mark, which can indicate future price targets once a trend resumes. This ability to project forward gives traders an edge in defining profit-taking strategies.
For instance, if Bitcoin rises from $90,000 to $100,000 and retraces before continuing its ascent, the subsequent extension can predict movement towards areas like $106,180. Understanding Fibonacci extensions allows traders to set up appropriate exit strategies, aligning profit-taking with projected market behavior based on Fibonacci levels. This proactive approach not only enhances overall trading effectiveness but also builds a trader’s confidence in their market forecasts.
Addressing Limitations of Fibonacci Retracement
Despite its popularity, Fibonacci retracement has limitations that traders must navigate. The subjective nature of identifying significant high and low points can lead to different interpretations among traders, resulting in varying retracement levels. This discrepancy makes it essential for traders to develop their analysis frameworks in conjunction with Fibonacci levels to maintain a consistent approach across trades.
Additionally, Fibonacci retracement may falter in sideways or choppy markets where predictable price behaviors are less pronounced. While its application thrives in trending conditions, reliance solely on Fibonacci levels without context from other indicators or market conditions can yield misleading signals. An integrated trading plan that considers the market structure and employs multiple technical analysis tools serves to mitigate the limitations associated with using Fibonacci retracements.
Practical Applications of Fibonacci Retracement in Bitcoin Trading
In the context of Bitcoin’s inherent volatility, Fibonacci retracement offers a structured framework for navigating rapid price movements. Traders can use Fibonacci levels to identify critical zones for entry points, enhancing their ability to capitalize on price swings that characterize the cryptocurrency market. Whether focusing on shorter time frames for swing trading or analyzing broader trends on daily charts, the strategic application of Fibonacci lines can assist in managing trades effectively.
Furthermore, the ability to respond quickly to price changes is crucial in the fast-paced world of bitcoin trading. By routinely applying Fibonacci retracement levels on their charts, traders can ensure they are positioned to take advantage of market fluctuations. This adaptability is paramount in establishing a disciplined trading routine that aligns with the unpredictable nature of Bitcoin and its frequent price shifts.
Developing a Fibonacci Mindset in Trading
Adopting a Fibonacci mindset involves understanding the tool’s mathematical foundations while integrating it into trading psychology. Rather than seeking absolute predictions about future price movements, successful traders utilize Fibonacci retracement as a framework for mapping probabilities. This approach promotes a disciplined attitude towards trade execution, which is crucial in the volatile Bitcoin trading environment characterized by emotional impulses.
By implementing Fibonacci retracement thoughtfully, traders can remain grounded amidst market chaos, relying on logic dictated by price levels. Beyond just technical analysis, the Fibonacci mindset emphasizes the importance of risk management and emotional control in trading. In an often tumultuous market like Bitcoin, where emotional decision-making can lead to poor choices, a structured and mathematically elegant approach enhances a trader’s overall success rate.
Frequently Asked Questions
What is Fibonacci Retracement in Bitcoin Trading and how is it used?
Fibonacci retracement in Bitcoin trading is a technical analysis tool that helps traders identify potential support and resistance levels by analyzing the vertical distance between significant price points. By drawing Fibonacci levels from a high to a low (or vice versa), traders can predict where a price retracement might halt before continuing in its original direction. Key Fibonacci levels include **23.6%**, **38.2%**, **50%**, **61.8%**, and **78.6%**, which signify areas where traders may consider entering or exiting positions.
How do Fibonacci levels influence Bitcoin trading strategies?
Fibonacci levels play a crucial role in Bitcoin trading strategies by providing insights into potential price reversals and continuation points. Traders use these levels to set entry and exit points based on observed market behavior. For example, if Bitcoin retraces to the **61.8% level** and shows signs of a bullish reversal, traders may initiate long positions. Consequently, integrating Fibonacci retracement into trading strategies can enhance decision-making processes in volatile crypto markets.
What is the difference between retracement and reversal in Bitcoin trading?
In Bitcoin trading, a retracement refers to a temporary price pullback within an existing trend, while a reversal signifies a complete change in trend direction. Fibonacci retracement levels help traders distinguish between these two scenarios. If Bitcoin retraces to the **38.2% or 50% level** and resumes its trend, it indicates a retracement. Conversely, if it fails to hold key Fibonacci levels with decreasing momentum, this may signal a trend reversal.
How can Fibonacci extension be used in Bitcoin trading?
Fibonacci extension in Bitcoin trading is utilized to project potential price targets beyond retracement levels, aiding traders in setting exit points. By applying Fibonacci extension levels to a recent price trend—such as a rise from $90,000 to $100,000—traders can identify target prices, such as the **161.8% extension**, which might indicate future resistance at **$106,180**. This method enhances trade management as trends evolve.
Can Fibonacci retracement be combined with other technical analysis tools for Bitcoin trading?
Yes, combining Fibonacci retracement with other technical analysis tools can significantly improve trading outcomes in the Bitcoin market. For example, aligning Fibonacci levels with indicators like the Relative Strength Index (RSI) or moving averages allows traders to validate potential reversal signals. A bullish candlestick pattern at the **38.2% retracement level** coupled with RSI suggesting oversold conditions creates a higher probability trading opportunity.
What are the limitations of using Fibonacci retracement in Bitcoin trading?
The primary limitations of using Fibonacci retracement in Bitcoin trading include its subjectivity and reliance on the correct identification of key high and low points. Different traders may draw Fibonacci levels differently, leading to varied analysis. Additionally, Fibonacci retracement is most effective in trending markets; in sideways or choppy market conditions, it may generate less reliable signals, highlighting the importance of using additional confirmation tools.
How can beginners effectively utilize Fibonacci retracement in their Bitcoin trading approach?
Beginners can effectively utilize Fibonacci retracement in Bitcoin trading by first learning to identify significant price highs and lows on a chart, then drawing the relevant Fibonacci levels. They should practice observing how the price reacts to these levels in various market conditions, combining this tool with other technical indicators for confirmation. Additionally, managing risk through stop-loss orders placed near key Fibonacci supports can help protect their capital.
Why is the 61.8% Fibonacci level often referred to as the ‘golden ratio’ in Bitcoin trading?
The 61.8% Fibonacci level is referred to as the ‘golden ratio’ in Bitcoin trading because it appears frequently in nature and architecture, representing an important mathematical constant. In financial markets, this ratio often influences trader behavior, resulting in significant price respect at this level. Many market participants consider it a critical point of support or resistance, making it an essential focus for traders using Fibonacci retracement.
| Key Aspect | Description |
|---|---|
| Fibonacci Retracement | A tool used to determine support and resistance levels based on the Fibonacci sequence. |
| Key Levels | Common levels: 23.6%, 38.2%, 50%, 61.8%, 78.6%. These indicate potential reversal points. |
| The Golden Ratio | 61.8% is significant for traders as prices often react around this level. |
| Combination with Indicators | Traders often use Fibonacci retracement alongside other technical tools like RSI or MACD. |
| Retracement vs. Reversal | A retracement is temporary, while a reversal indicates a trend change. |
| Fibonacci Extension | Used to project future price targets based on the same high-low points. |
| Limitations | Subjective nature; effectiveness depends on identifying correct points. |
| Practical Use | Helps traders maintain discipline in volatile bitcoin market conditions. |
Summary
Fibonacci Retracement in Bitcoin Trading is a vital tool for traders seeking to navigate the volatile landscape of cryptocurrency markets. By identifying key price levels through the Fibonacci sequence, traders can efficiently predict potential support and resistance zones, enhancing their decision-making process. Understanding and applying Fibonacci retracement levels can significantly improve trading outcomes by transforming chaotic price movements into structured strategies. As a result, this technique is essential for both novice and experienced traders aiming to capitalize on the fluctuating prices of Bitcoin.