
SUI price analysis reveals a period of relative stability in the cryptocurrency market as it hovers around the $2 mark, buoyed by support levels established in November of last year. This robust trading volume at the current price indicates strong buyer interest, creating a buffer against potential downturns. Yet, for SUI to embark on a bullish ascent, it will need to align its momentum with the performance of Bitcoin (BTC), given their historical price correlation. The key resistance zone at the $3 mark, where both the 50 EMA and 200 EMA converge, stands as a critical hurdle that traders must watch closely. As market dynamics shift, understanding SUI’s support levels, resistance zones, and trading strategies is essential for navigating the unpredictable landscape of cryptocurrency investments.
In recent discussions around market trends, the evaluation of SUI’s price trajectory has become increasingly relevant for investors navigating the volatile crypto landscape. Current assessments highlight critical support thresholds and the importance of understanding trading volumes for making informed trading decisions. A keen focus on the interaction of SUI with Bitcoin prices offers insights into broader market movements and potential trading strategies. Meanwhile, the presence of significant resistance at pivotal price points complicates prospects for upward mobility. As traders seek viable paths forward, an in-depth understanding of resistance zones and market sentiment will be fundamental to their success.
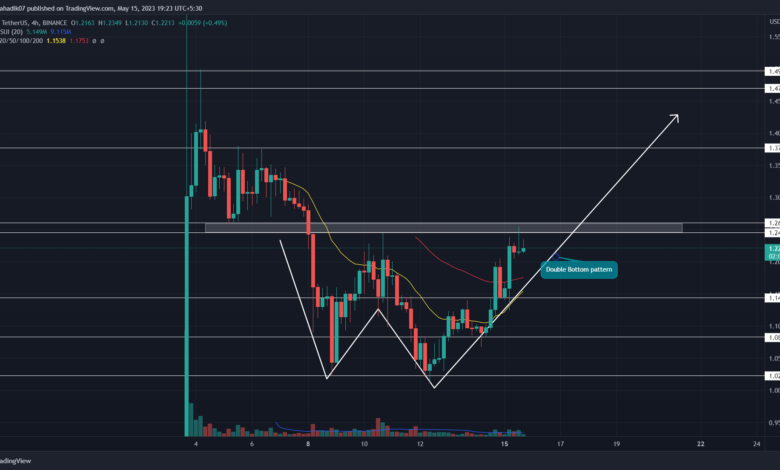
Understanding SUI Price Analysis and Market Dynamics
SUI has been stabilizing around the crucial $2 mark, which serves as a significant support level established since November of last year. The trading volume in this price range has been notably high, which not only reinforces the existing support but also indicates strong market interest. Recognizing these support levels is critical for traders looking to understand market stability versus volatility. Beyond mere observation of price levels, traders can develop strategies based on such dynamics, leveraging SUI’s trading behavior as part of broader crypto trading strategies.
The analysis shows that a sustainable upward shift in SUI’s price will likely correlate directly with movements in Bitcoin (BTC). As BTC shows strength, SUI may also break through key resistance levels, particularly the critical $3 mark, which is a formidable barrier due to the convergence of the 50 EMA and the 200 EMA in that zone. This relationship underscores the importance of BTC price correlation in determining the trading strategies around SUI; understanding how these two cryptocurrencies interact can enhance traders’ decision-making processes.
SUI Trading Volume: Signals and Implications
The trading volume of SUI has surged notably around the $2 support level, indicating a robust interest among investors at this price point. High trading volumes typically signal increasing liquidity, which can lead to more significant price movements, both upwards and downwards. This observation should prompt traders to closely monitor trading volume as it can provide insights into market sentiment and the potential for upcoming price shifts. For those employing advanced crypto trading strategies, the analysis of trading volume can act as a critical indicator for predicting market behavior.
Furthermore, as SUI trends near its resistance zone, a heightened trading volume can signify a potential breakout. Such volume spikes suggest stronger buying interest, implying traders are willing to push the price higher. However, should the trading volume dwindle, it may indicate a lack of conviction from buyers, potentially leading to price reversals or corrections. Understanding these dynamics helps traders position themselves more successfully, allowing them to capitalize on short-term movements while guarding against downturns.
Key Support Levels and Their Importance for SUI
Understanding SUI’s support levels is paramount for anyone looking to invest or trade in this cryptocurrency. The established $2 support level has proven resilient, absorbing liquidity and maintaining price stability over recent months. Should SUI decisively drop below this critical support, traders might anticipate a more pronounced correction, which could lead to further declines. Thus, recognizing and analyzing these support levels plays a vital role in developing effective trading strategies.
In addition to the $2 mark, traders should also consider the implications of the upcoming resistance levels, such as the $3 zone, where significant technical factors converge. The influence of the 50 EMA and 200 EMA in this area can create a challenging environment for upward movements. Therefore, it’s essential for traders to not only focus on support levels but to also understand the implications of potential resistance zones. This holistic view aids in crafting effective risk-management strategies while navigating SUI’s volatile market.
Resistance Zones and Breakout Potential for SUI
As SUI approaches its resistance zones, traders must evaluate the likelihood of a breakout. The convergence of the 50 EMA and the 200 EMA around the $3 mark presents a considerable barrier that can impact short-term price movements. If SUI manages to break through this zone, it could signify the beginning of a new upward trend, potentially providing lucrative opportunities for traders. However, without adequate volume to support this move, the potential for a false breakout remains.
Additionally, the response to the resistance zones will dictate the overall market sentiment for SUI. Should traders see a significant rally beyond $3, it could attract more bullish sentiment, igniting further investment and trading activity. However, failure to break through resistance might lead to renewed bearish pressure, particularly if short positions remain dominant in the market. Therefore, monitoring price action around these critical resistance points is vital for traders looking to maximize their positions in SUI.
Analyzing BTC Price Correlation with SUI
The correlation between Bitcoin (BTC) and SUI is a crucial factor for traders to consider. As Bitcoin’s price fluctuates, the impact often extends to other cryptocurrencies, including SUI. Recent observations indicate that Bitcoin’s strength could propel SUI upwards, especially if it crosses key price thresholds. Hence, understanding how BTC market movements relate to SUI’s price volatility can provide traders with a competitive edge in their strategies.
Moreover, aligning SUI trading strategies with BTC’s performance can help traders manage risk more effectively. For instance, if BTC showcases strong buying momentum, leveraging that scenario can enhance expectations for SUI’s price performance. Conversely, if BTC faces strong headwinds, traders must be cautious with their positions in SUI, as it may also reflect broader market sell-offs.
Implementing Crypto Trading Strategies for SUI
Successful trading in SUI requires a well-defined set of crypto trading strategies tailored to current market conditions. Traders should incorporate technical analysis tools such as moving averages, RSI, and MACD to determine optimal entry and exit points. Understanding the significance of these indicators can help in identifying potential buying opportunities when SUI approaches its support levels, or conversely, signaling caution during market corrections.
Moreover, engaging in volume analysis and tracking liquidations can provide additional layers for evaluating SUI’s price potential. For traders, this involves observing how short and long positions are populated within various price brackets. This analysis not only aids in recognizing possible breakout scenarios but also enlightens traders about prevailing market sentiment, which is vital for shaping effective trading strategies.
SUI Indicators: Leveraging Technical Analysis
Utilizing indicators such as the Relative Strength Index (RSI) and Moving Average Convergence Divergence (MACD) is essential when analyzing SUI’s market movements. The current stability of the RSI, despite SUI’s price reaching new lows, suggests a potential accumulation phase and indicates underlying buying interest. This suggests traders should remain vigilant, as such signs might signal an upcoming reversal or breakout.
On the other hand, the MACD’s sideways movement signifies indecision in the market. However, increasing buying pressure could shift this indicator’s direction, prompting bullish momentum for SUI. Hence, incorporating these technical indicators into a trader’s strategy not only helps in understanding market dynamics but also in formulating timely responses to shifts in price behavior.
Evaluating SUI’s Market Trends and Future Prospects
Monitoring market trends for SUI is pivotal for identifying potential future price movements. With ongoing price stabilization around the $2 mark, the outlook could shift positively if SUI breaks above identified resistance levels. Traders must analyze broader market conditions, particularly Bitcoin’s performance, as this will likely play a significant role in determining SUI’s short-term trajectory.
Future prospects for SUI also hinge upon sustaining momentum amid market volatility. If SUI can solidify a strong base above $2, it can attract more investor confidence and trading activity. Ongoing evaluations of trading volume, technical indicators, and market sentiment will be crucial in shaping traders’ expectations and strategies going forward.
Author’s Insights on SUI and Market Engagement
Bastian Keller (Bitbull), with a rich background in forex and crypto trading, provides unique insights into the mechanics of trading cryptocurrencies like SUI. His approach emphasizes the importance of understanding the underlying factors that influence price movements. Through his platform, Bitbull Trading, he aims to empower traders to engage more confidently and strategically in the market.
As trends in cryptocurrency evolve rapidly, it is crucial for traders to stay informed through continuous education and adaptation. Keller encourages traders to leverage available resources, such as his educational videos, to build their skills and enhance their trading strategies. Understanding the nuances of trading within the context of supportive communities can also play a pivotal role in navigating the complexities of crypto markets.
Frequently Asked Questions
What is the current SUI price analysis indicating about trading volume?
The current SUI price analysis shows that the cryptocurrency is stabilizing around the $2 mark, bolstered by strong trading volume in this range. This high trading volume not only supports the current price but also indicates robust interest from traders, providing a solid buffer against downward movements.
How do support levels impact the SUI price analysis?
In the SUI price analysis, support levels play a crucial role, particularly the $2 mark which has proven to be effective since November. If SUI maintains its position above this level, it can buffer against stronger corrections. However, a sustained drop below $2 could expose SUI to significant downward pressure.
What role does BTC price correlation play in SUI price analysis?
BTC price correlation is vital in SUI price analysis, as the performance of Bitcoin directly influences SUI’s potential for upward movement. For SUI to achieve a sustainable increase, Bitcoin needs to show strength in the market, particularly as SUI approaches critical resistance levels.
What crypto trading strategies can be derived from SUI price analysis?
The SUI price analysis suggests several crypto trading strategies, such as monitoring key support and resistance levels. Traders should consider taking positions around the $2 support and watch for breakouts above the $3 resistance, adjusting their strategies based on BTC’s market movements and trading volume patterns.
What does the SUI resistance zone mean for future price movements?
The SUI resistance zone, particularly around the $3 mark where the 50 EMA and 200 EMA converge, indicates a critical hurdle for price advancements. Successfully breaking through this zone could set the stage for further upward momentum, while failure to do so may result in a corrective phase for SUI.
| Key Points | Details |
|---|---|
| SUI Price Stability | SUI stabilizes around $2, supported by previous levels. |
| Trading Volume | High trading volume at this level reinforces support for SUI. |
| Liquidity on Downside | All available liquidity on the downside has been absorbed. |
| BTC Influence | SUI’s price movement is heavily dependent on Bitcoin’s strength. |
| Resistance Levels | $3 is a crucial hurdle due to the convergence of the 50 EMA and 200 EMA. |
| Potential Correction | Dropping below $2 could initiate a stronger downward correction. |
| 4-Hour Chart Analysis | Short delta dominating; liquidity favors upward movement. |
| RSI Stability | RSI indicates stable buying interest even as price hit new lows. |
| MACD Direction | MACD is currently moving sideways; no clear direction is indicated. |
Summary
SUI price analysis reveals that SUI continues to stabilize around the $2 mark, bolstered by significant support levels from previous months. While a sustainable increase hinges on Bitcoin’s market performance, the strong trading volume at this price point indicates a resilient foundation. Monitoring key resistance at $3, particularly the convergence of the 50 EMA and 200 EMA, will be essential for potential bullish movements. Investors should remain vigilant since failure to maintain the $2 support could lead to a correction. Overall, the next few days are critical for assessing SUI’s upward potential.


